I was lucky enough to get a few weeks of leave for Christmas, so I went home to my family’s house in Vermont with my wife, Jackie, and our cat. In between camping and ski-hiking, I was looking for another little project.
My parents bought the land which our house is on when we still lived in Beijing, and there’s a lot of history in the woods. Only two modern roads survive in the immediate area, but if you go into the woods it’s clear that there used to be others, which have been neglected for a long time. The woods are also home to an entire system of bike trails, maintained by the Brewster River Mountain Bike Club, of which my dad is a member. There’s a lot going on up there, but if you look at Google Maps, it’s utterly empty.
I have a neighbor who is a GIS professional, and I’ve talked to him before about map making, mainly because I want to create more print-friendly maps of Shenandoah, so I can hike without a cell phone. My dad asked if I would try making a map of the woods behind our house, and I was happy to give it a shot.
In this article, I’ve hidden data which is very personally identifying, so that I’m not publishing our address or our neighbors’ online.
I don’t want to spend 100 dollars a year on an ArcGIS license, and in this locked-down corporate world, I want to use as much free and open-source software as I can, so I used QGIS for all my mapping. I read a few online tutorials and then I started working.
First, I needed to map out the land cover of the surrounding area. Most of my town is forested, but not all. I got this data from The National Map, namely its USGS 7.5 minute Topo Maps. I loaded the land cover, POIs, and trails layers, and trashed the rest.
Actually, that’s not really true. Originally I loaded all the layers, but I threw them out one by one once I found better information elsewhere, until only those three remained. On this blog, though, I’m pretending that I did everything perfectly from the start.
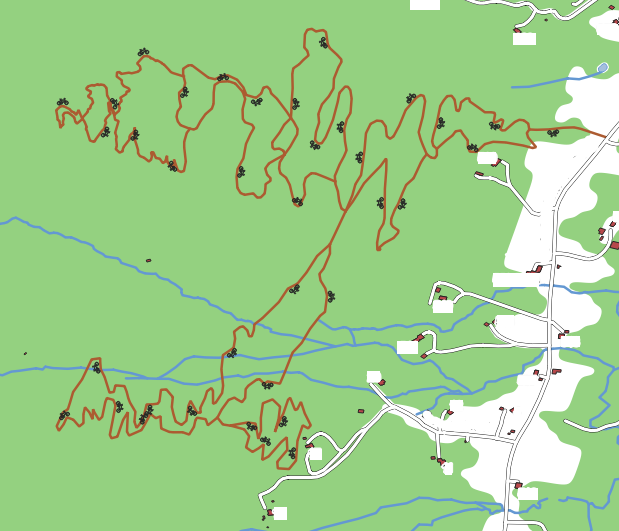
Surprisingly, the trails layer was pretty good. It contained a bunch of the BRMBC trails, which I labeled with a cute little bike.
There were a couple of errors in the road and driveway data. My driveway was too short, a nearby road wasn’t included, etc. Instead, I decided to get the road and driveway data from OpenStreetMap. There is a helpful plugin for QGIS called QuickOSM and I followed this tutorial to download data from it. Weirdly, on OSM, roads and driveways are labeled as “lanes” and “access” respectively, so it took some trial and error to download the right data. I combined the lanes and access layers into a layer called all_roads, and styled it up a bit. I added curved labels so the roads would be labeled as well.
I got a bunch of other useful data from OpenStreetMap, including building shapes, street numbers, and waterways (more accurate than The National Map).
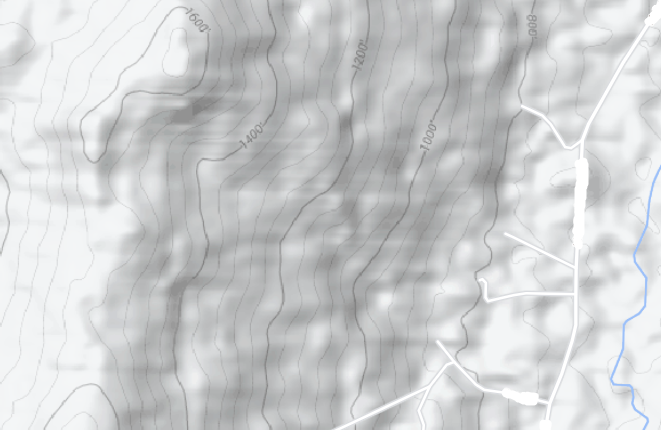
Next, I looked for elevation data. I wanted contour lines and a shaded hillside, so the landscape wouldn’t look so flat. Following this tutorial, I got the GMTED2010 data from USGS EarthExplorer. This data was pretty low-res, but if I enabled oversampling it looked okay. I stole the contour lines from The National Map dataset which I downloaded earlier. This was a pretty imperfect solution; the GMTED2010 data slices cover huge swaths of the US, and they’re not well suited for this scale of mapping, but I didn’t know any better. I used the hillshade algorithm to give the area a sense of depth.
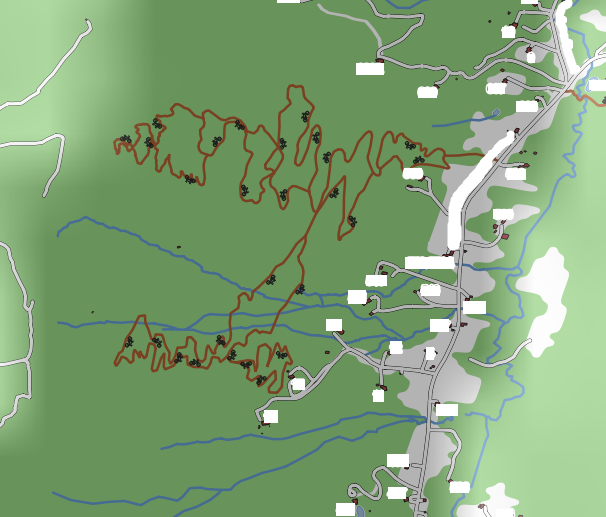
Yeah, it’s clearly low-resolution. Don’t worry, I fixed it later. But in the mean time, I had a tougher task. I knew there were old access roads and blazed trails in the woods behind our house, but I had no idea how to find a map of them. Besides the BRMBC trails, none of these were documented anywhere, and they may have never been officially recorded.
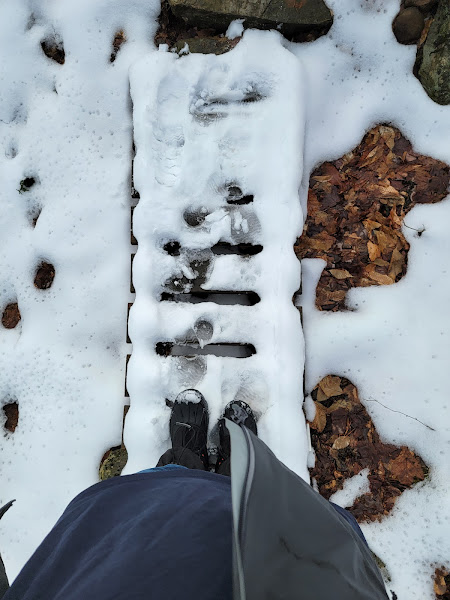
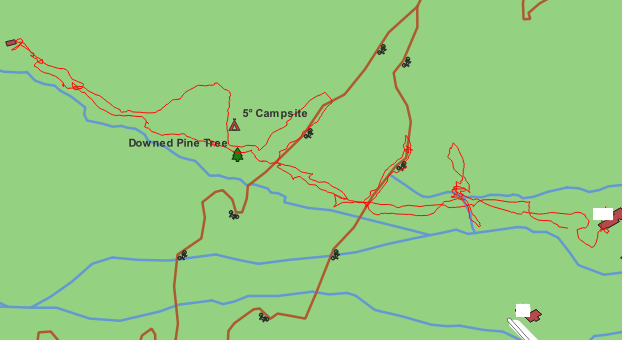
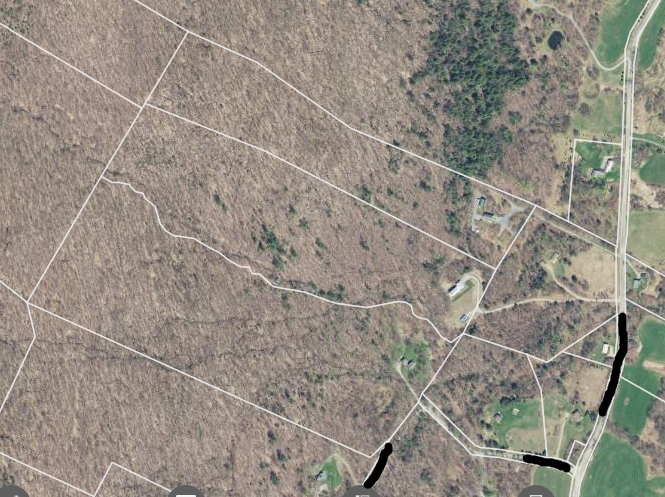
So I found them the hard way. I went hiking with Jackie, and tried her patience by running up and down trails and streams while wearing my Garmin Fenix 5S. We took photos of a few landmarks and marked them on the map, too. I also marked the spot where my dad and I went camping in 5 degree weather a few nights earlier. In order to incorporate the tracks into QGIS, I got the GPX file from Garmin and imported it into QGIS as a vector layer.
Here’s what our track looked like.
I plotted in a few of the trails and streams which we followed, but I wasn’t able to nail them down perfectly. Plus, I was worried about GPS error and my own memory. At the same time, I was getting irritated with my elevation data. As I zoomed farther in, the slope became more and more pixelated. Plus, since I imported the contour lines from a vector dataset, I couldn’t get any more detail out of them.
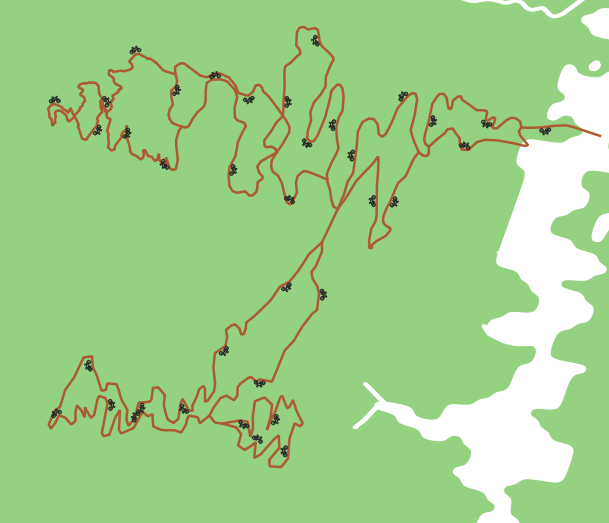
I screwed around on EarthExplorer with a few other digital elevation models, but I couldn’t find one I liked, so I did a little googling, and found the excellent 1 meter Digital Elevation Models from USGS. I remade the hillshading. Look at the difference!
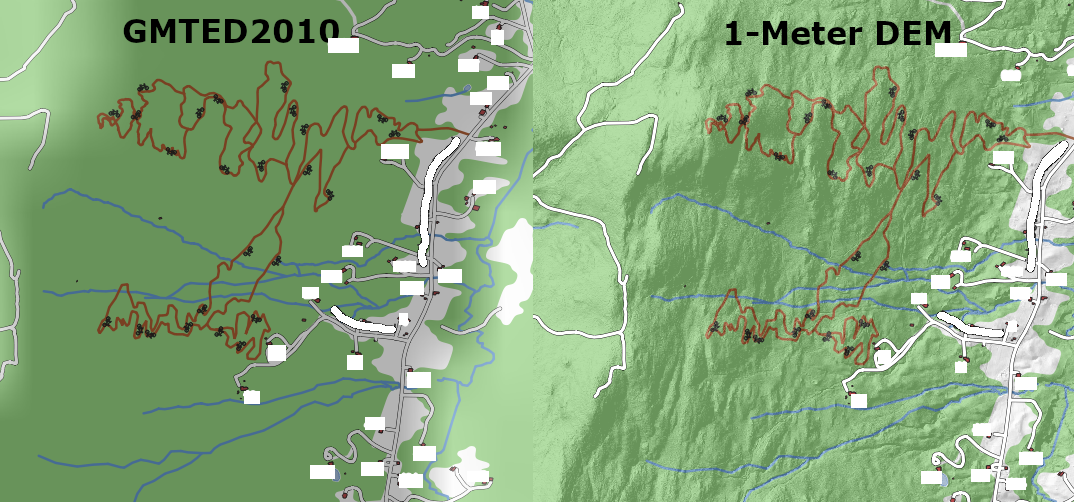
In fact, the new DEMs looked so good that I could find a lot of the trails which Jackie and I had hiked beforehand.
I got a little interested in this: how can you find trails in the woods from DEM data? It turns out, this is a fairly well-researched topic [1] [2] [3], and has been studied in particular at the Naval Postgraduate School, of which many of my friends are alumni! Small world.
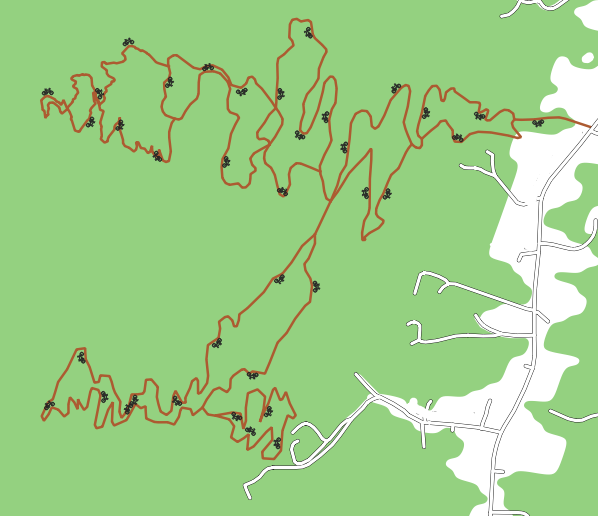
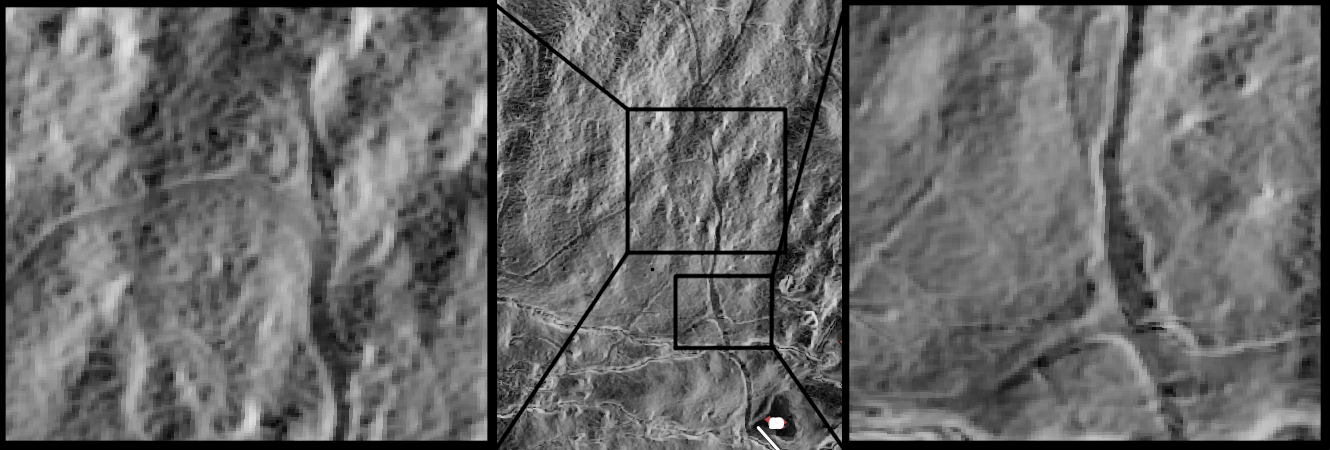
In this paper (which is actually about a harder topic), the authors propose using the magnitude of the gradient of DEM data as a method of finding trails. The magnitude of the gradient is also known as the slope, and QGIS contains the GDAL slope tool for use on raster data. When I found and displayed the slope across the area, the trails almost lit up.
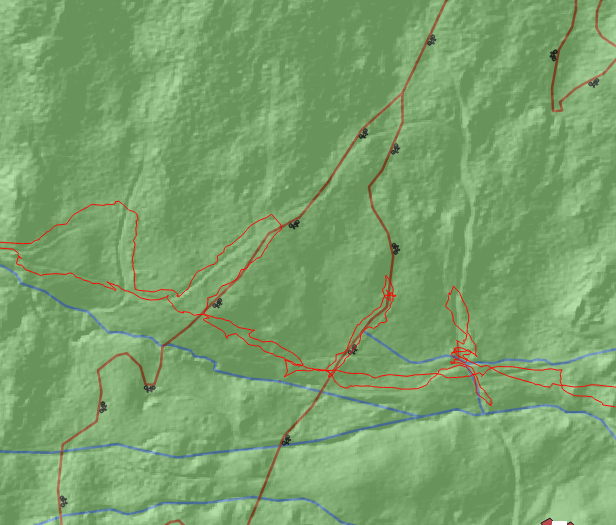
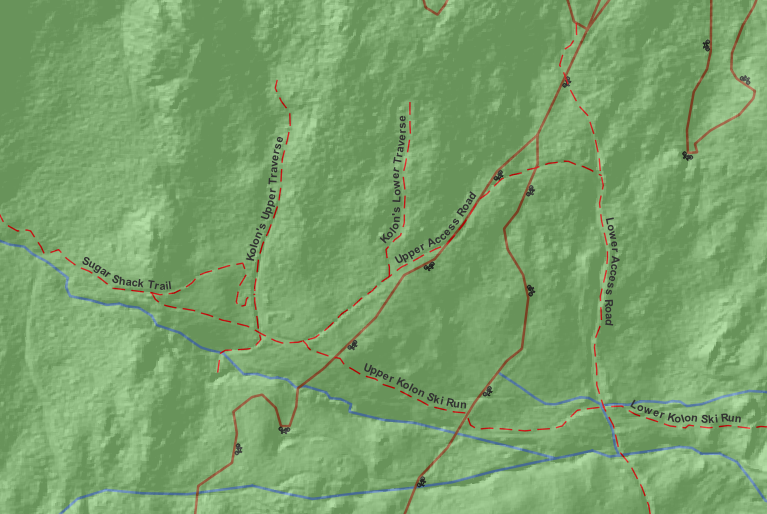
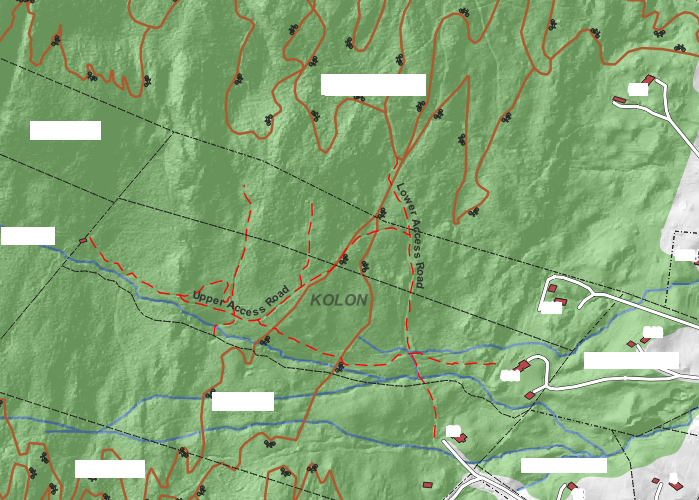
So using this, my hike path, and a little extra knowledge from my dad, I drew and labeled (somewhat uncreatively) the trails which we had found.
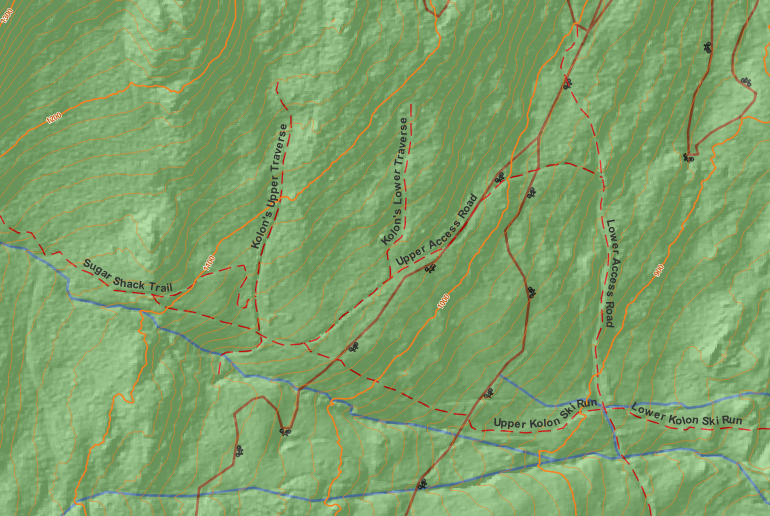
While I’m a supporter of the metric system, I know that feet are the accepted unit of elevation in the US, so I wanted to translate the DEMs to feet before I made and labeled contour lines. I did this with the Raster Calculator. Then, I made fresh contours and labeled them with rule-based labels, so a label only appeared every 100 feet.
Finally, I wanted a breakdown of how much land we actually owned. The deed to our house maps out our land claim very cryptically, and we have done a few walks through the woods trying to find out exactly where the boundary is. Fortunately, there is a tool called Parcel Viewer published by the Vermont Center for Geographic Information which displays all of the property lines in the state.
Even more conveniently, the layers on parcel viewer are available for download. These layers include ownership data for each parcel, so you can tell who owns all the land. It’s kind of crazy, actually. For any piece of land in Vermont, you can look up who lives there as a matter of public record.
On my map, I wanted to just label each owner’s last name. The dataset has first and last names of each owner, but the last name always comes first. Fortunately, the label dialogue in QGIS supports regular expressions, so I wrote a simple regex to match the first word of each name.

I’ve blacked out our neighbors’ names, even though they are a matter of public record, to try and be conscious of their privacy. Here’s what the parcels looked like on my map.
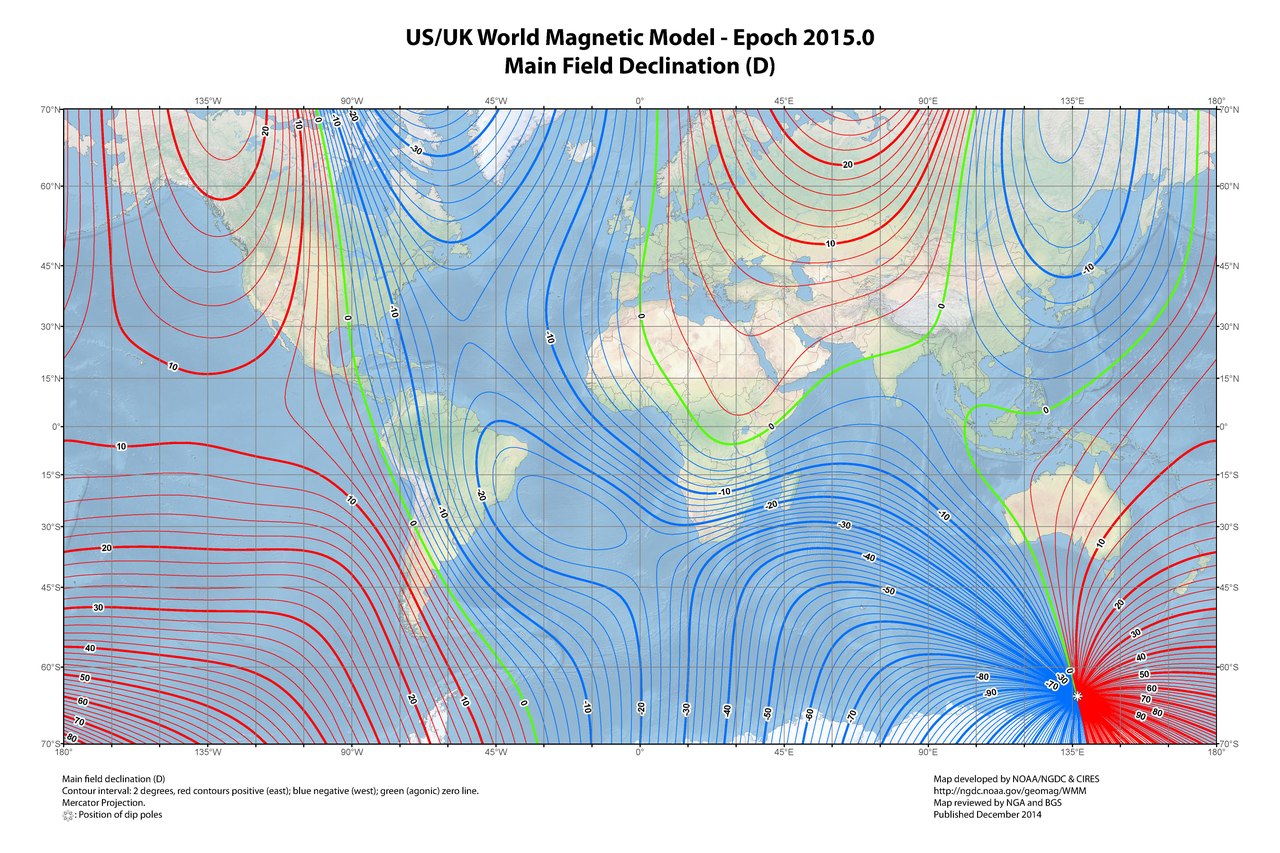
When trying to trace out our property lines in the past, we have had to walk lines of bearing. When trying to do this, magnetic declination becomes an issue. Essentially, a magnetic compass does not reliably point towards the North Pole, or True North. In Northern Vermont in December, 2021, it was about 14 degrees off. This may not seem like a lot, but it can be very significant when trying to walk a line of bearing between property lines.
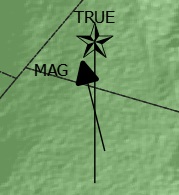
In QGIS, we can use the magnetic declination plugin, published by hacked-crew. While the plugin can generate a compass rose, I chose to create my own.
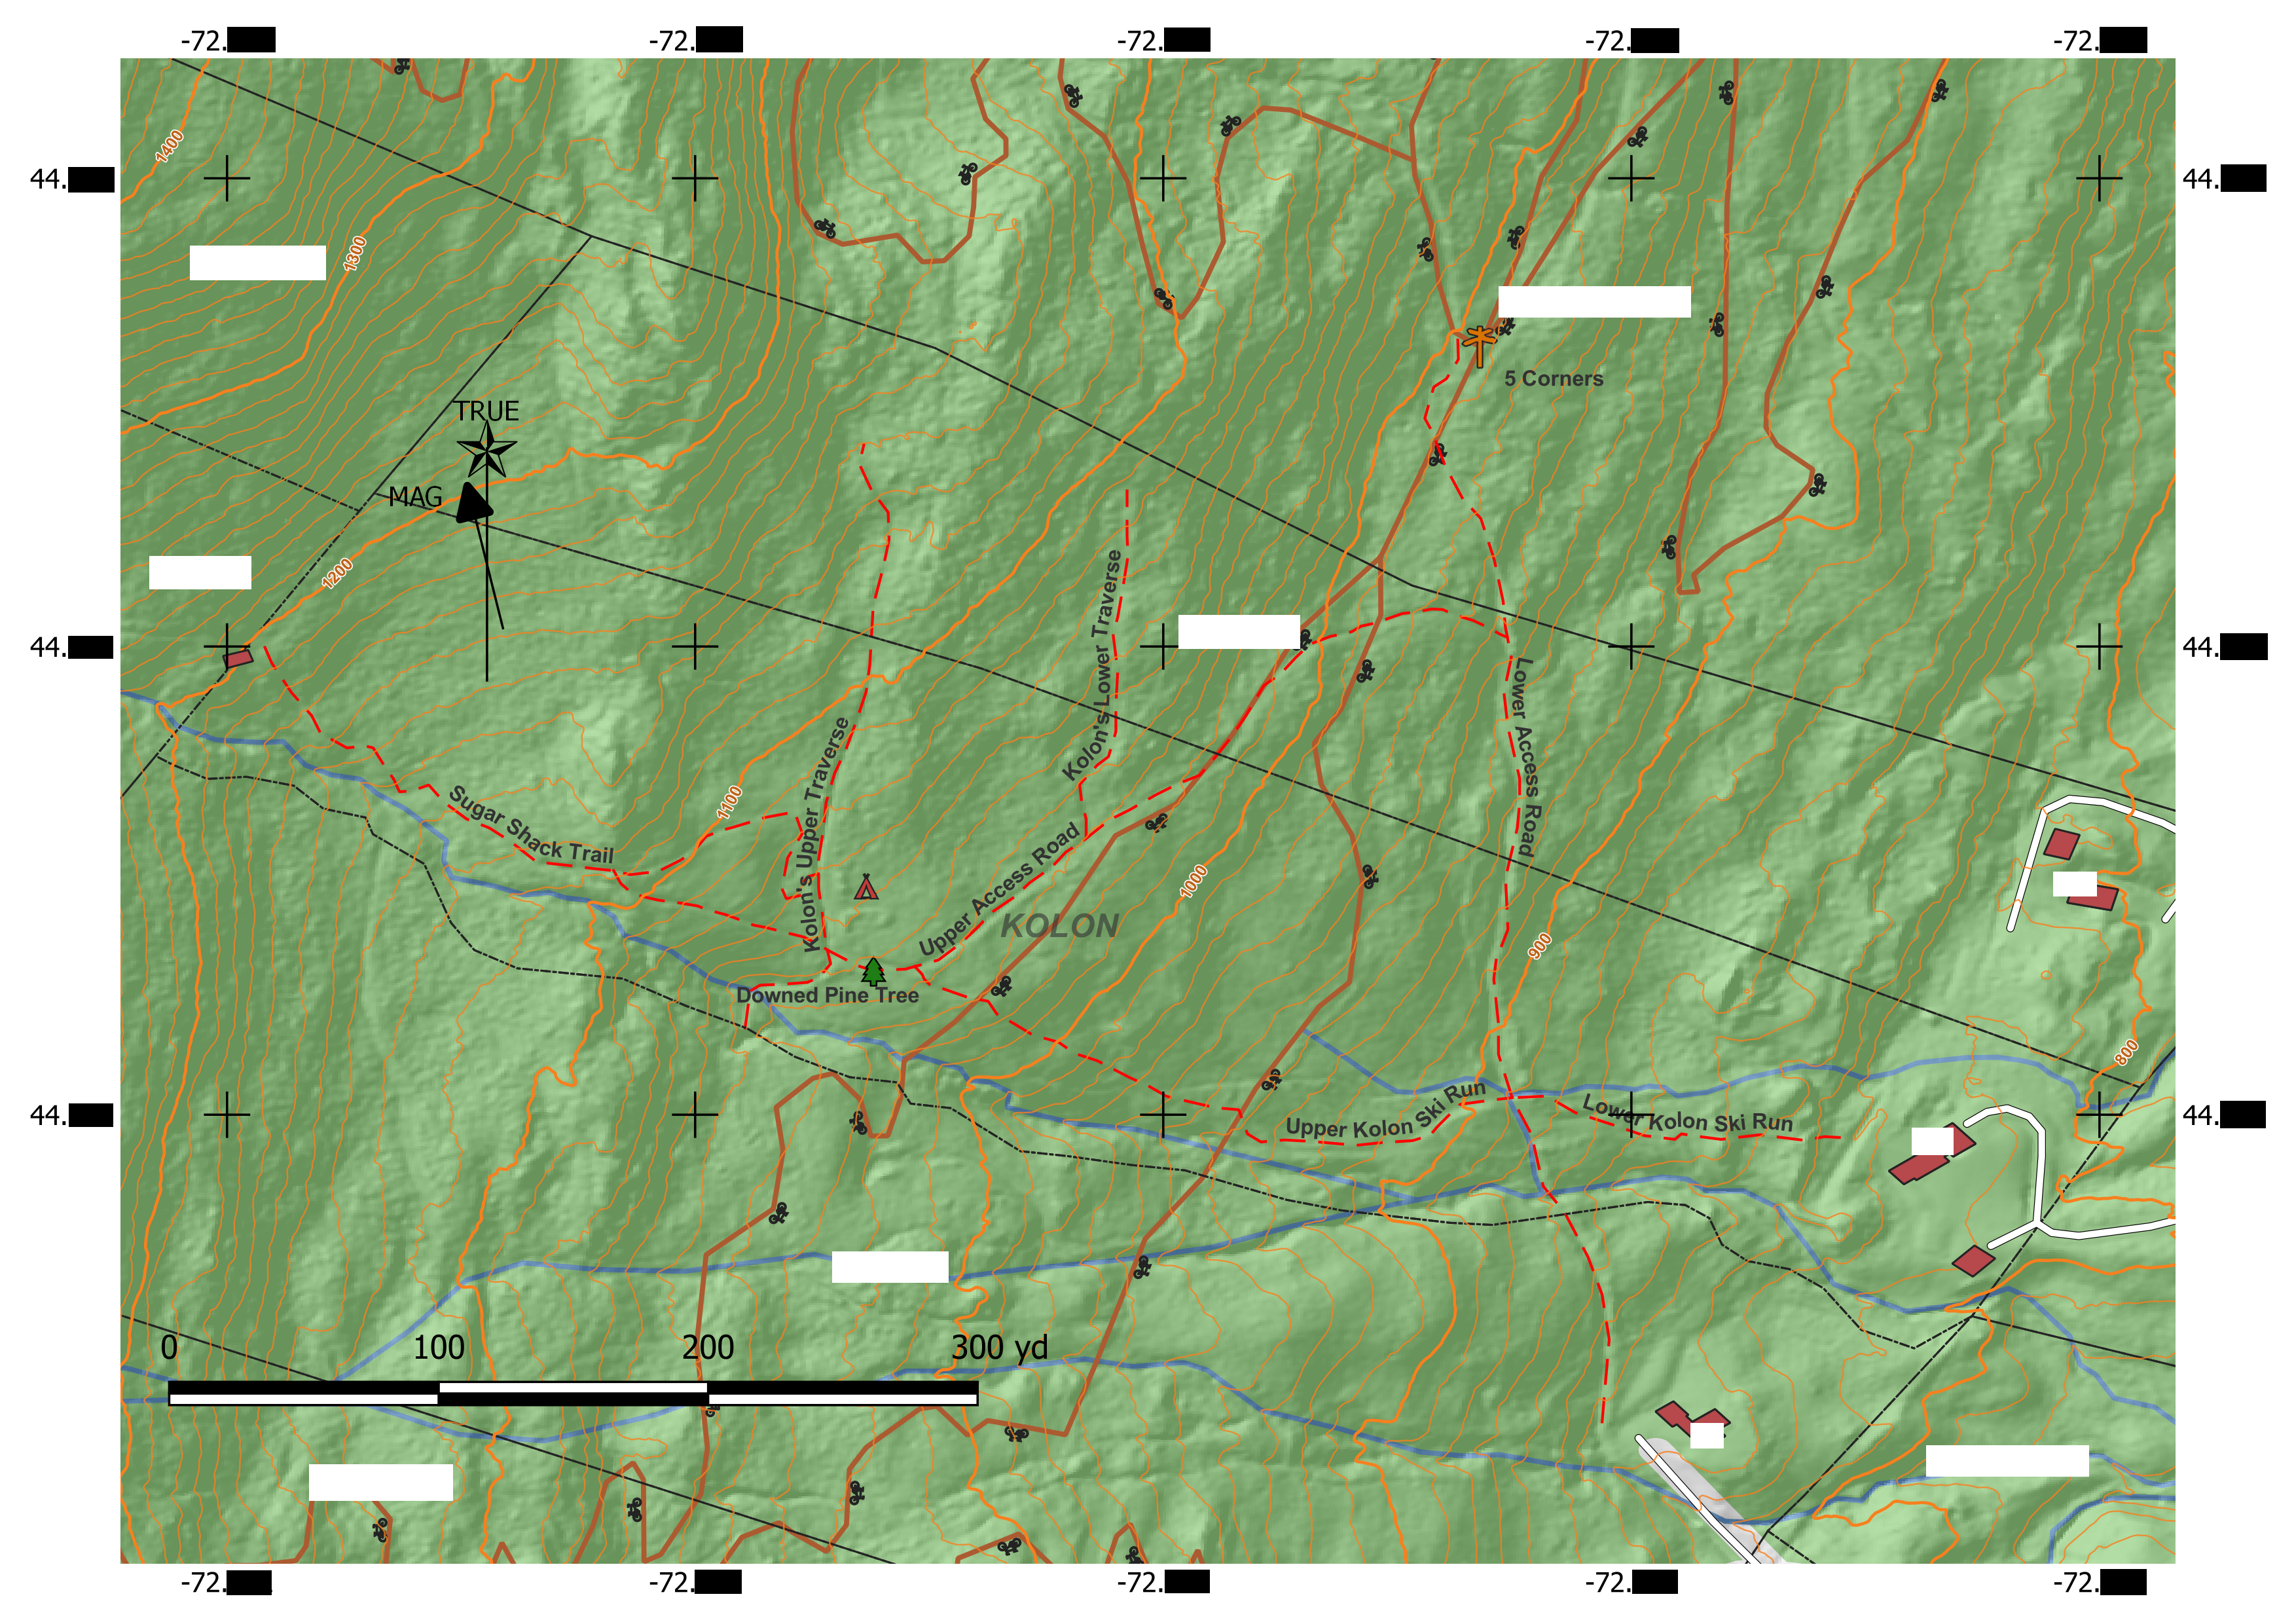
Finally I used this tutorial to create a map layout, grid lines, a scale bar, etc. And here’s the finished map. Click it to see the full thing!
The biggest thing that I learned with this project, besides how to use GIS software, is that there’s a lot of data out there. Official records which are accessible to anyone contain a lot of information that we typically think of as personal. If you want to find out someone’s address, especially in a rural setting, you can probably do it with OpenStreetMap and parcel data. There’s also a lot of good data around, like streams, trails, and buildings which you might think aren’t documented anywhere, and very high-res elevation data, which you can use to figure out all sorts of things about the lay of the land.
And if you can’t find it online, you can always hike it!