To the extent you can, avoid letting intermediaries come between you and your audience. In some types of work this is inevitable, but it’s so liberating to escape it that you might be better off switching to an adjacent type if that will let you go direct. — Paul Graham, How to Do Great Work
When I write a new article, I like to see if people are reading it. I think everyone who does something creative cares if people consume and appreciate it, and I’m no exception.
When I first started putting things on the web, I thought that this would be a pretty simple desire to fulfill. Every web server keeps some sort of log, so I could just watch it and see how many hits my articles had. I host most of my sites with Nginx, so here’s what the logs look like:
10.244.0.218 - - [10/Jul/2025:17:01:14 +0000] "GET /a.js HTTP/1.1" 200 7046 "https://carlkolon.com/" "Mozilla/5.0 (X11; Linux x86_64) AppleWebKit/537.36 (KHTML, like Gecko) Chrome/128.0.0.0 Safari/537.36"
10.244.7.34 - - [10/Jul/2025:17:01:15 +0000] "OPTIONS /a HTTP/1.1" 204 0 "https://carlkolon.com/" "Mozilla/5.0 (X11; Linux x86_64) AppleWebKit/537.36 (KHTML, like Gecko) Chrome/128.0.0.0 Safari/537.36"
10.244.7.34 - - [10/Jul/2025:17:01:20 +0000] "POST /a HTTP/1.1" 200 44 "https://carlkolon.com/" "Mozilla/5.0 (X11; Linux x86_64) AppleWebKit/537.36 (KHTML, like Gecko) Chrome/128.0.0.0 Safari/537.36"
10.244.7.34 - - [10/Jul/2025:17:01:22 +0000] "POST /a HTTP/1.1" 200 44 "https://carlkolon.com/" "Mozilla/5.0 (X11; Linux x86_64) AppleWebKit/537.36 (KHTML, like Gecko) Chrome/128.0.0.0 Safari/537.36"
10.244.2.246 - - [10/Jul/2025:17:01:23 +0000] "POST /a HTTP/1.1" 200 44 "https://carlkolon.com/" "Mozilla/5.0 (X11; Linux x86_64) AppleWebKit/537.36 (KHTML, like Gecko) HeadlessChrome/128.0.0.0 Safari/537.36"
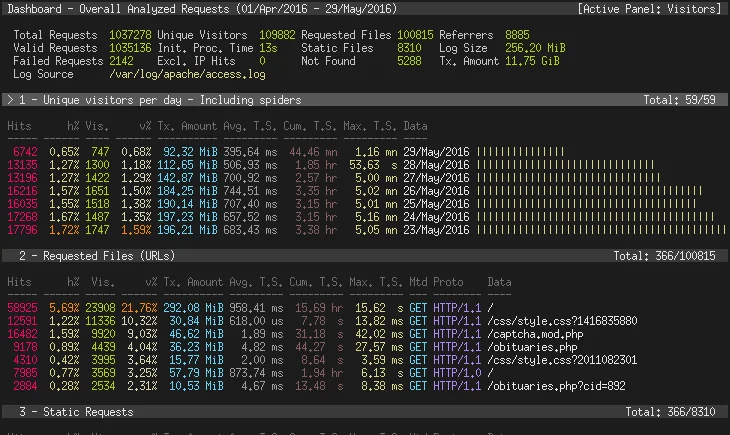
It’s hard to make sense of these by themselves, but there are plenty of log analyzers online that will help. GoAccess is one of the most popular. It has great built-in dashboards like the one below, and it can also make html pages that you can serve on your site. Plus, it’s free and open source!
An approach like this works great for old-school sites running on a dedicated server, but it didn’t work out-of-the-box for me, because I deploy my applications in a more “modern” (complex) way.
How I deploy my sites
I’ve been putting stuff on the web since about 2020 or 2021. I have 4 websites.
- This one,
- ewatchbill.com, a scheduler app built with React/FastAPI,
- bearingsonly.net, a submarine combat game built with React/NodeJS,
- jfmm.net, a semantic search engine built with HTMX/Django.
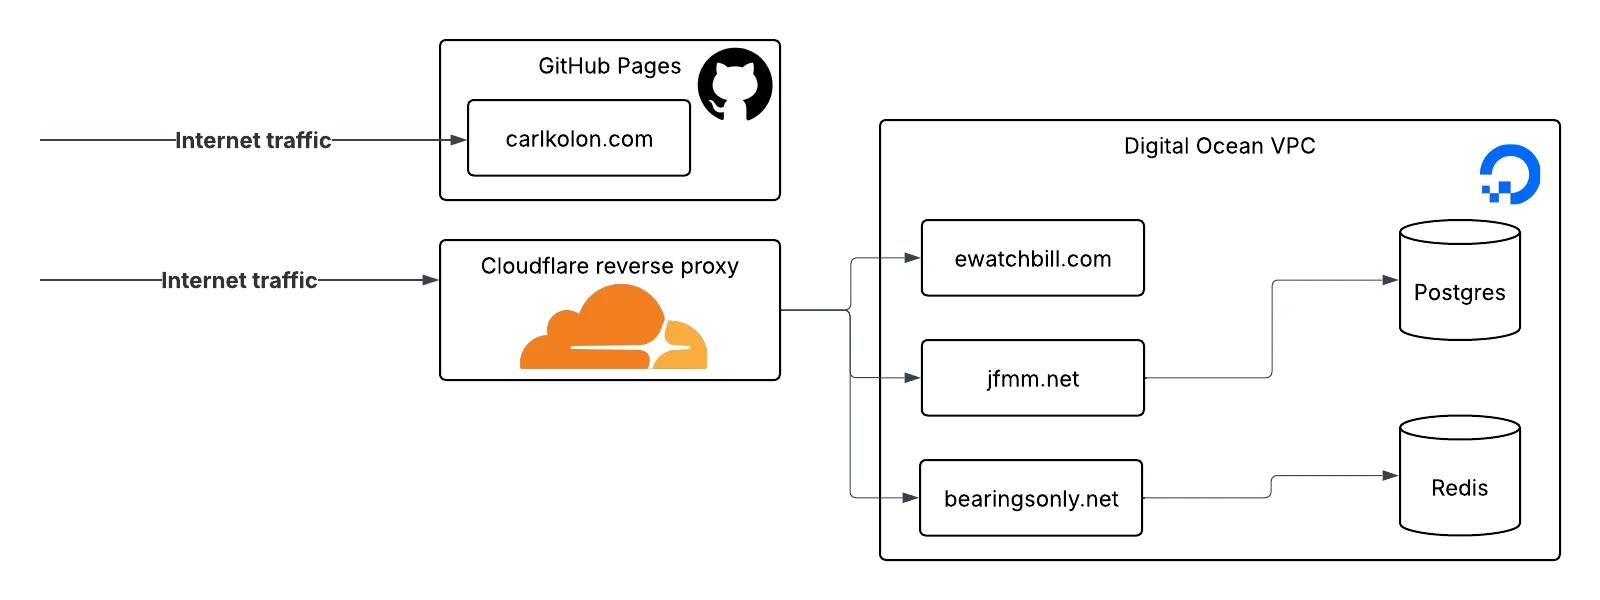
Since this site is static, I host it for free on GitHub Pages. The other sites all require server-side computation, so I host them as containers on DigitalOcean’s app platform. At $5 per month, this is cheaper than some approaches I’ve used in the past (like renting a droplet or EC2 instance). Also, I don’t have to configure HTTPS and deployment actions myself. Another nice benefit is that DigitalOcean puts my sites behind a Cloudflare reverse proxy, which protects me from some types of bots and attackers.
I have one shared Postgres instance on DigitalOcean with databases for the apps that require them, and another shared Redis cache. I do it like this to save money. Hosted databases are expensive!!
If I were hardcore, I’d host all my sites on my own hardware at my house, but cloud hosting is more convenient for a lot of reasons. From a safety perspective, I don’t want to open my home to outside traffic1. From a user experience perspective, I want the uptime and speed advantages of a cloud-hosted server (and caching from Cloudflare).
Server logs won’t work
On their own, server logs aren’t good enough for my purposes. First of all, they’re inconvenient. Every time I deploy my apps, the containers get rebuilt, which deletes the log files. If I want to persist logs, I would have to save them somewhere besides the file system on the container. I’d have to save them to Postgres or mount an S3 bucket or something. Even if I did this, I’d have to face the problem of what to do about carlkolon.com. Since GitHub handles the hosting infrastructure centrally, I don’t have access to the server logs.
Server-side logs also can only tell you a limited amount of information about your users. For example, they don’t capture page interactions like link clicks, scrolls, button presses, etc.
Finally, there is a lot of bot traffic. More than half of worldwide internet traffic is bots. Of these, not all are malicious! For example, I want Google crawlers to index my pages. When I post an article on Facebook or Linkedin, I want those sites to fetch the meta info to make pretty banners. But I don’t want to fool myself into thinking those hits are actual viewers. It would be nice if I could filter out as much of them as possible.
Google Analytics
Google Analytics is what most people use for this. It’s two lines of frontend code that you can copy-paste into your site’s HTML. Then you can connect to a dashboard which shows you some information about your users.
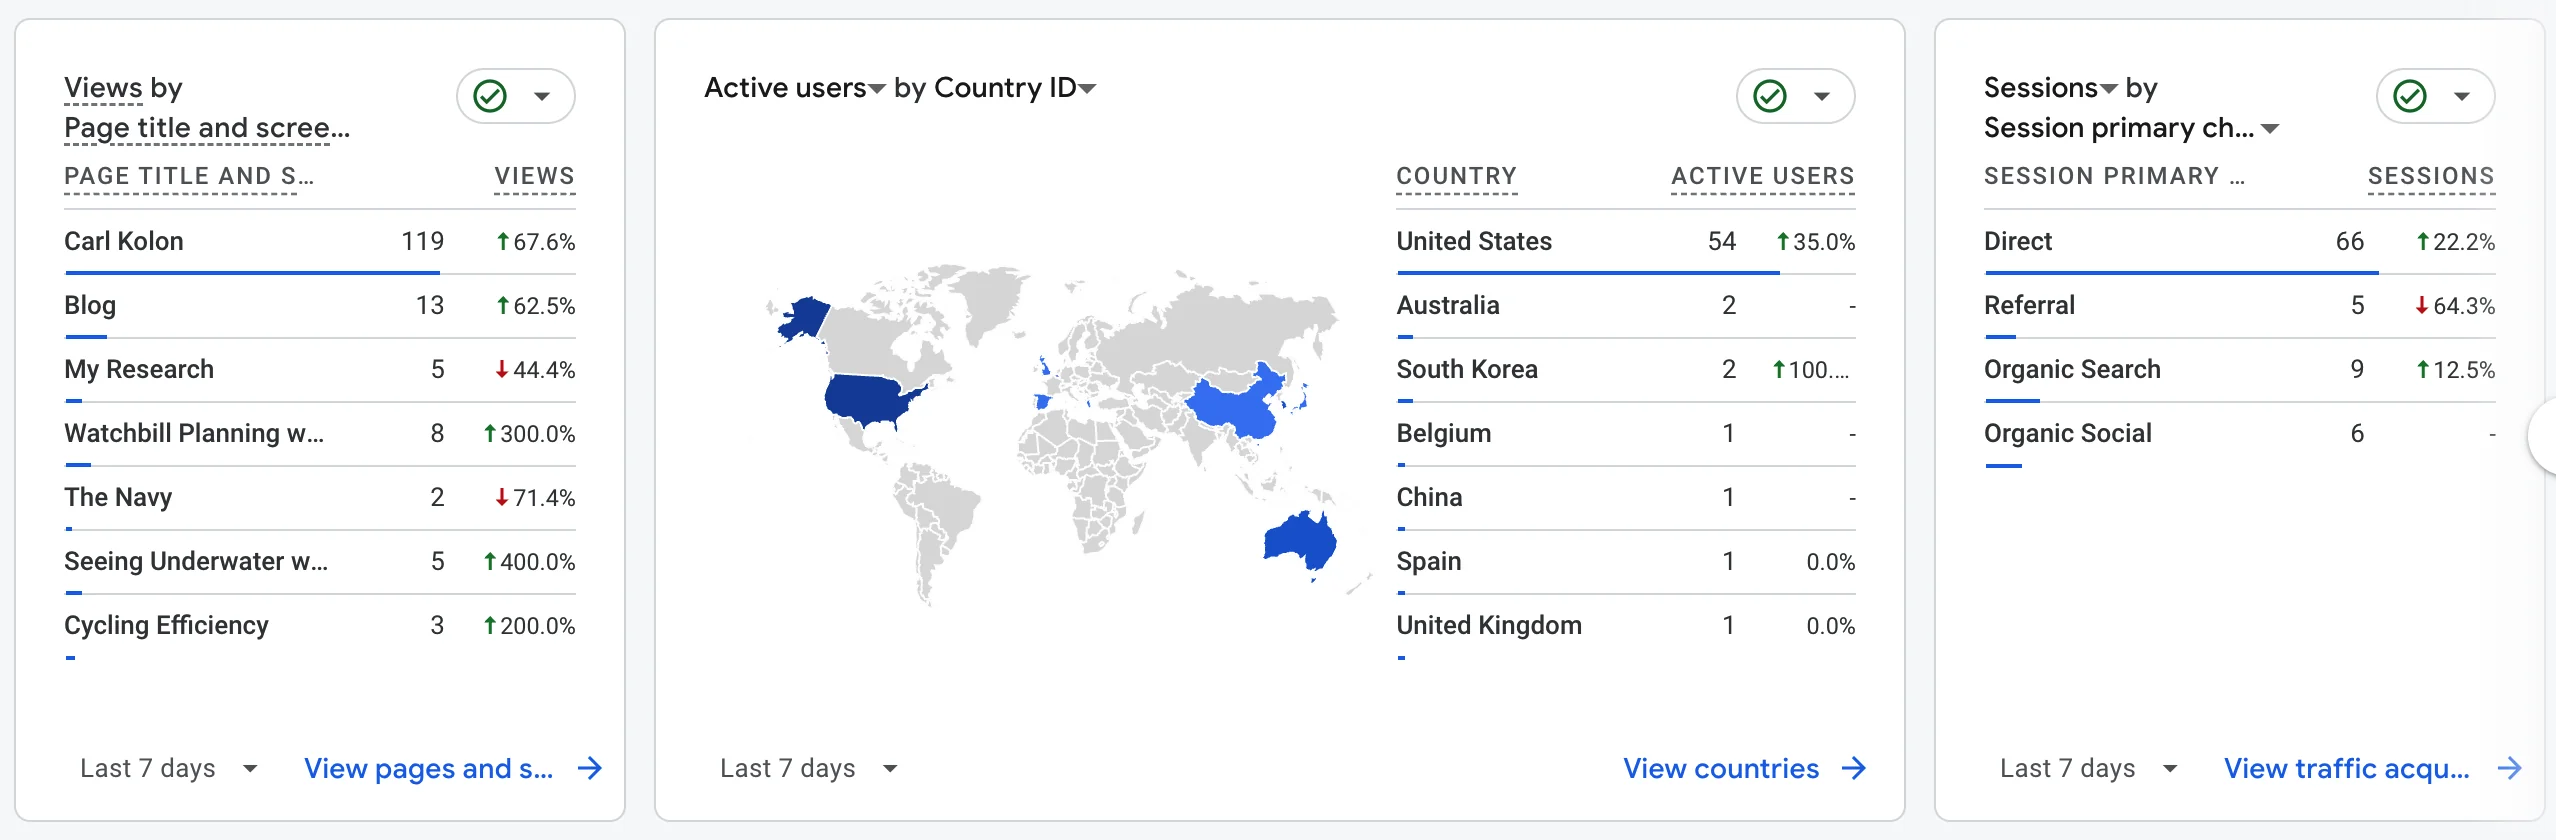
Google Analytics is great in some respects, and it exposes some clear benefits of frontend analytics, compared to server logs. For example, Google Analytics can tell you the following information:
- How long your users spend viewing your page (dwell time)
- How far your users scroll down your page (scroll depth)
- Link clicks
- Form interactions
Server logs don’t pick up on these things because they don’t typically trigger requests. Your page doesn’t reload when you scroll a little.
Google Analytics reports these events by executing JavaScript in your browser, which triggers internet requests when you scroll, click, interact, or close the page. Google then aggregates and anonymizes these events, and displays them to you in your dashboard.
I’ve used Google Analytics for years, but recently I’ve felt like moving away. I don’t enable GA’s more advanced tracking (which would require a cookie banner: the scum of the internet). Even so, I don’t like contributing to Google’s enormous database of information on my readers. I especially hate that Google can track your behavior across many different sites. I’m the only person who needs to know that you read this blog.
I also think that Google Analytics is a little too bloated for what I want. Google designed Google Analytics for maximizing online revenue, which I don’t make from this site. Among all this commercial data, it can be hard to find the information that I actually find useful. I don’t need to track “conversions” or “key events”—I just want to know if anyone is reading my articles.
Finally, there are things I do want to see that Google Analytics doesn’t provide me. For example, there are a lot of subtle cues that distinguish real traffic from bots. Frontend analytics are more likely to ignore bot traffic than server logs are, because many bots won’t even execute JavaScript. But nowadays, lots of sites are dynamic and require JavaScript to function at all, so a fair number of scrapers operate virtual browsers. In this case, there are a few other giveaways. Bots tend to use Linux machines, where most human readers use Mac OS or Windows. Bots often have a screen resolution set to a low, round number (like 800x400 px), whereas the screen resolution of real devices varies. Most humans use mobile devices, but few bots do.
Most pings in the logs come from Linux devices, based on their User-Agent strings.
Mozilla/5.0 (X11; Linux x86_64) AppleWebKit/537.36 (KHTML, like Gecko) Chrome/128.0.0.0 Safari/537.36
Ignoring Linux devices would filter out most bots, but Google Analytics doesn’t let you do this. You don’t have access to the underlying data. Since Google tracks users across sessions, I think they’re trying to limit their liability in case people try to use the data to deanonymize users. In my case, I don’t plan on collecting enough data to do that.
I evaluated a couple other tools while I was considering moving away from Google. Matomo and Umami seem like great options, and both support self-hosting for free. By now, though, I was starting to get the itch to do this myself.
I had recently registered cck.sh and planned to use it as a link shortener, so I tacked my analytics service on as an extra feature.
Storing analytics events
Since I already had a Postgres server, I decided to use that to store the data. First I tried using Vector to get logs from a web server and move them to Postgres. Annoyingly, the Vector Postgres sink (still in beta) doesn’t seem to support SSL, but DigitalOcean’s hosted Postgres servers require it. Also, the task of moving logs wasn’t too hard, and I decided to just write my own FastAPI server to do it.
In Postgres, I created two tables, analytics_sessions and analytics_events. Each new page load creates a session. An event could represent lots of types of interactions inside the session, like link clicks and page scrolls. If I wanted to see everything that a user did during a visit, I could search the event rows matching a session ID. Unlike Google, I don’t persist session IDs (or any other data) between different page loads. If a user visits my site twice, it’s two different sessions.
Detecting user events
To do frontend analytics, I needed the user’s browser to report events back to the server. I wrote a simple JavaScript immediately invoked function expression to do this. First, the function would send a request back to my server on page load. This would contain some basic information about the viewer’s machine. Some of these things (like User-Agent or Referer headers) are visible in the server logs, but other things (like screen resolution or time zone) aren’t. Once I had the payload, I would base64 encode it and send it to the server in a POST request.
Why base64 encode? In early iterations, I made the payload a URL query parameter, so I didn’t want to send raw JSON. In the end, I standardized around a POST body, but I already had written the server-side parse logic, so I kept the same string payload.
My payload looks more or less like this:
const baseData = {
  u: url,
  r: referrer,
  pt: pageTitle,
  p: platform,
  ua: userAgent,
  l: language,
  tz: timezone,
  sr: screenResolution,
};
Then before sending I’d tack on the session ID (if it exists, which it typically didn’t) and a l character to symbolize a page load.
sendAnalyticsData({
  ...baseData,
  s: window.SESSION_ID || null,
  t: "l",
});
When the server received the payload, I would decode it and insert a row into analytics_sessions.
with psycopg.connect(DATABASE_URL) as conn:
    with conn.cursor() as cursor:
        cursor.execute(
            """
            INSERT INTO analytics_sessions (
                -- blah blah blah
            ) VALUES (
                -- lots of placeholders
            )
            ON CONFLICT (id) DO UPDATE SET
                updated_at = CURRENT_TIMESTAMP
            RETURNING id
            """,
            (
                # lots of data
            ),
        )
        session_id_row = cursor.fetchone()
        if not session_id_row:
            raise ValueError("Failed to insert or update session")
        session_id = session_id_row[0]
The session_id here is a UUID which I would send back in the request. Then on the client I’d set it as a global property using the window object.
async (response) => {
  if (!response.ok) {
    return;
  }
  const { s } = await response.json();
  if (s) {
    window.SESSION_ID = s;
  }
};
To track scroll events, I registered a scroll listener, which would calculate the percentage scrolled and send it to the server. To prevent sending a ton of requests, I debounced it with a 250ms timeout and only sent requests when the percentage increased by more than 10.
window.addEventListener("scroll", () => {
  clearTimeout(scrollTimeout);
  scrollTimeout = setTimeout(() => {
    const scrollTop = window.pageYOffset || document.documentElement.scrollTop;
    const documentHeight = Math.max(
      document.body.scrollHeight,
      document.documentElement.scrollHeight,
    );
    const windowHeight = window.innerHeight;
    const scrollDepth = Math.round(
      ((scrollTop + windowHeight) / documentHeight) * 100,
    );

    if (scrollDepth > maxScrollDepth + 10) {
      maxScrollDepth = scrollDepth;

      const data = {
        ...baseData,
        s: window.SESSION_ID || null,
        t: "s",
        sd: scrollDepth,
      };
      sendAnalyticsData(data);
    }
  }, 250);
});
Tracking dwell time
The most interesting challenge would be tracking the amount of time a user stayed on the webpage. Some analytics applications ping an “alive” request to the server every so often to prove that the page is still loaded. This is robust, but kind of complex. I preferred tracking dwell time using the beforeunload event. This is a browser event that fires right before the page is about to close. When the user attempts to close the tab, the request would fire before the tab finished unloading.
const startTime = now();

window.addEventListener("beforeunload", () => {
  const data = {
    ...baseData,
    s: window.SESSION_ID || null,
    t: "e",
    es: Date.now() - startTime,
  };
  sendAnalyticsData(data);
});
Dwell time is a bad measure, though. If a user started reading my article, got bored, switched to a new tab, and then closed my article an hour later, that would represent an hour of dwell time. This is deceptive because the user might have only read my article for a few seconds. I was more interested in getting the user’s engaged time: the time they spent with the page in focus.
I used the visibilitychange event and document.visibilityState api to solve this problem. Every time there was a visibilitychange event, I could check the document.visibilityState and pause the timer if the document wasn’t visible.
function handleVisibilityChange() {
  if (document.visibilityState === "visible") {
    lastStart = Date.now();
  } else if (lastStart !== null) {
    engagedTime += Date.now() - lastStart;
    lastStart = null;
  }
}

if (document.visibilityState === "visible") {
  lastStart = Date.now();
}

document.addEventListener("visibilitychange", handleVisibilityChange);
Back to the server logs
While I trusted the user’s device to report most data, I still had to go to the server to get the user’s IP address. Client-side JavaScript doesn’t have access to the device’s IP.
It’s easy to screw this up. Here’s a server log from the top of the page:
10.244.0.218 - - [10/Jul/2025:17:01:14 +0000] "GET /a.js HTTP/1.1" 200 7046 "https://carlkolon.com/" "Mozilla/5.0 (X11; Linux x86_64) AppleWebKit/537.36 (KHTML, like Gecko) Chrome/128.0.0.0 Safari/537.36"
The IP address - the first thing displayed in the log - isn’t the user’s actual address. You can tell because it begins with 10, and all IP addresses beginning with 10 are private.
In fact, this is the IP address of the Cloudflare reverse proxy between my server and the broader internet. Luckily, Cloudflare preserves the original address in the X-Forwarded-For header. It contains a comma-separated list of addresses that a request passed through. The left-most one corresponds to the user’s address. The FastAPI service behind my Nginx reverse proxy can access this header.
@app.post("/some_endpoint")
async def some_endpoint(
    request: Request, body: SomeBody
) -> SomeResponse:
    x_forwarded_for=request.headers.get("X-Forwarded-For")
    ip_address = x_forwarded_for.split(",")[0].strip()
    # then do something with this information
Geolocating and anonymizing
IP addresses are a decent indicator of someone’s location (though they’re not perfect, and you shouldn’t rely on them for determining someone’s language). I wanted to use them to generate a map of my readers’ approximate locations. Plenty of companies make IP geolocation APIs and databases and tweak them over time. I don’t want to pay for access to an API, so I fetch the free GeoLite database from MaxMind as part of my container’s build process, and update it periodically. GeoLite is an IP geolocation database with reasonable accuracy. Since I’m downloading the database and doing lookups locally, I don’t have to worry about rate limiting or inadvertently sharing sensitive data.
def geolocate_ip(ip: str) -> Geolocation:
    with geoip2.database.Reader(DB_PATH) as reader:
        try:
            city = reader.city(ip)
            # access attributes like city.latitude, city.longitude, etc.
I also needed to follow California and EU law by making it impossible to identify users from their sessions 2. The locations provided by GeoLite are too approximate to uniquely identify visitors, but raw IP addresses themselves are a different story. It’s dubious that I could actually identify anyone uniquely from their IP address, but many jurisdictions consider uncensored IP addresses to be personal data in some legal situations. I wanted to anonymize them to be safe.
The most normal way to anonymize IP addresses is truncation: removing some number of trailing bits. I chose the same strategy that Google uses, and deleted the last byte of IPV4 addresses and the last 80 bits of IPV6 address. I represented them with subnet notation in my database so that I had a record of how much truncation I did. Truncating one byte from an IPV4 address is the same as the /24 subnet, and truncating 80 bits from an IPV6 address is the same as the /48 subnet.
                             1.23.45.67 -> 1.23.45.0/24
2001:0db8:abcd:1234:5678:9abc:def0:1234 -> 2001:0db8:abcd::/48
You might ask why I need to truncate so much data from IPV6 addresses, and so little for IPV4. These actually offer about the same amount of privacy.
Because IPV4 addresses are scarce, each internet service provider (ISP) receives only small blocks. For example, a small regional ISP may only get a /22 CIDR block, which contains only 1024 addresses. It’s likely that the ISP will assign most of these addresses to actual users. This means that truncating only the last byte produces a decent amount of ambiguity. Even better, many ISPs use network address translation (NAT) to share one address between customers, increasing the ambiguity further. This makes it unlikely that I could ever identify a user uniquely based on their /24 subnet.
Unlike IPV4 addresses, IPV6 addresses are numerous, and the possible address space numbers just under of them (about 340 billion billion billion). Because there is no scarcity, IPV6 addresses contain a lot more redundancy. The entire second half of an IPV6 address—the host identifier—acts as a key that identifies the device specifically. Sometimes, these host identifiers are even generated from the device’s MAC address and shared between networks (though this is now discouraged for privacy reasons). Clearly I had to strip the entire host identifier from the address.
Even without the host identifier, the first half of an IPV6 would still exactly identify the device’s network. Because of this I decided to remove another 16 of the least significant bits, storing only the first 48 bits and truncating the remaining 80. Just like in IPV4, I was removing the least significant quarter from the network-identifying part of the address. This is the same policy that Google follows so I felt pretty safe.
I truncated the addresses in my FastAPI endpoint using Python’s ipaddress library, and only stored IPs to disk after truncating.
from ipaddress import IPv4Address, IPv6Address, ip_address, ip_network

def anonymize_ip(ip_str: str) -> str:
    ip_obj = ip_address(ip_str)
    if isinstance(ip_obj, IPv4Address):
        network = ip_network(f"{ip_str}/24", strict=False)
        return str(network)
    if isinstance(ip_obj, IPv6Address):
        network = ip_network(f"{ip_str}/48", strict=False)
        return str(network)
    raise ValueError("Not a V4 or V6 IP address")
Visualizing the data
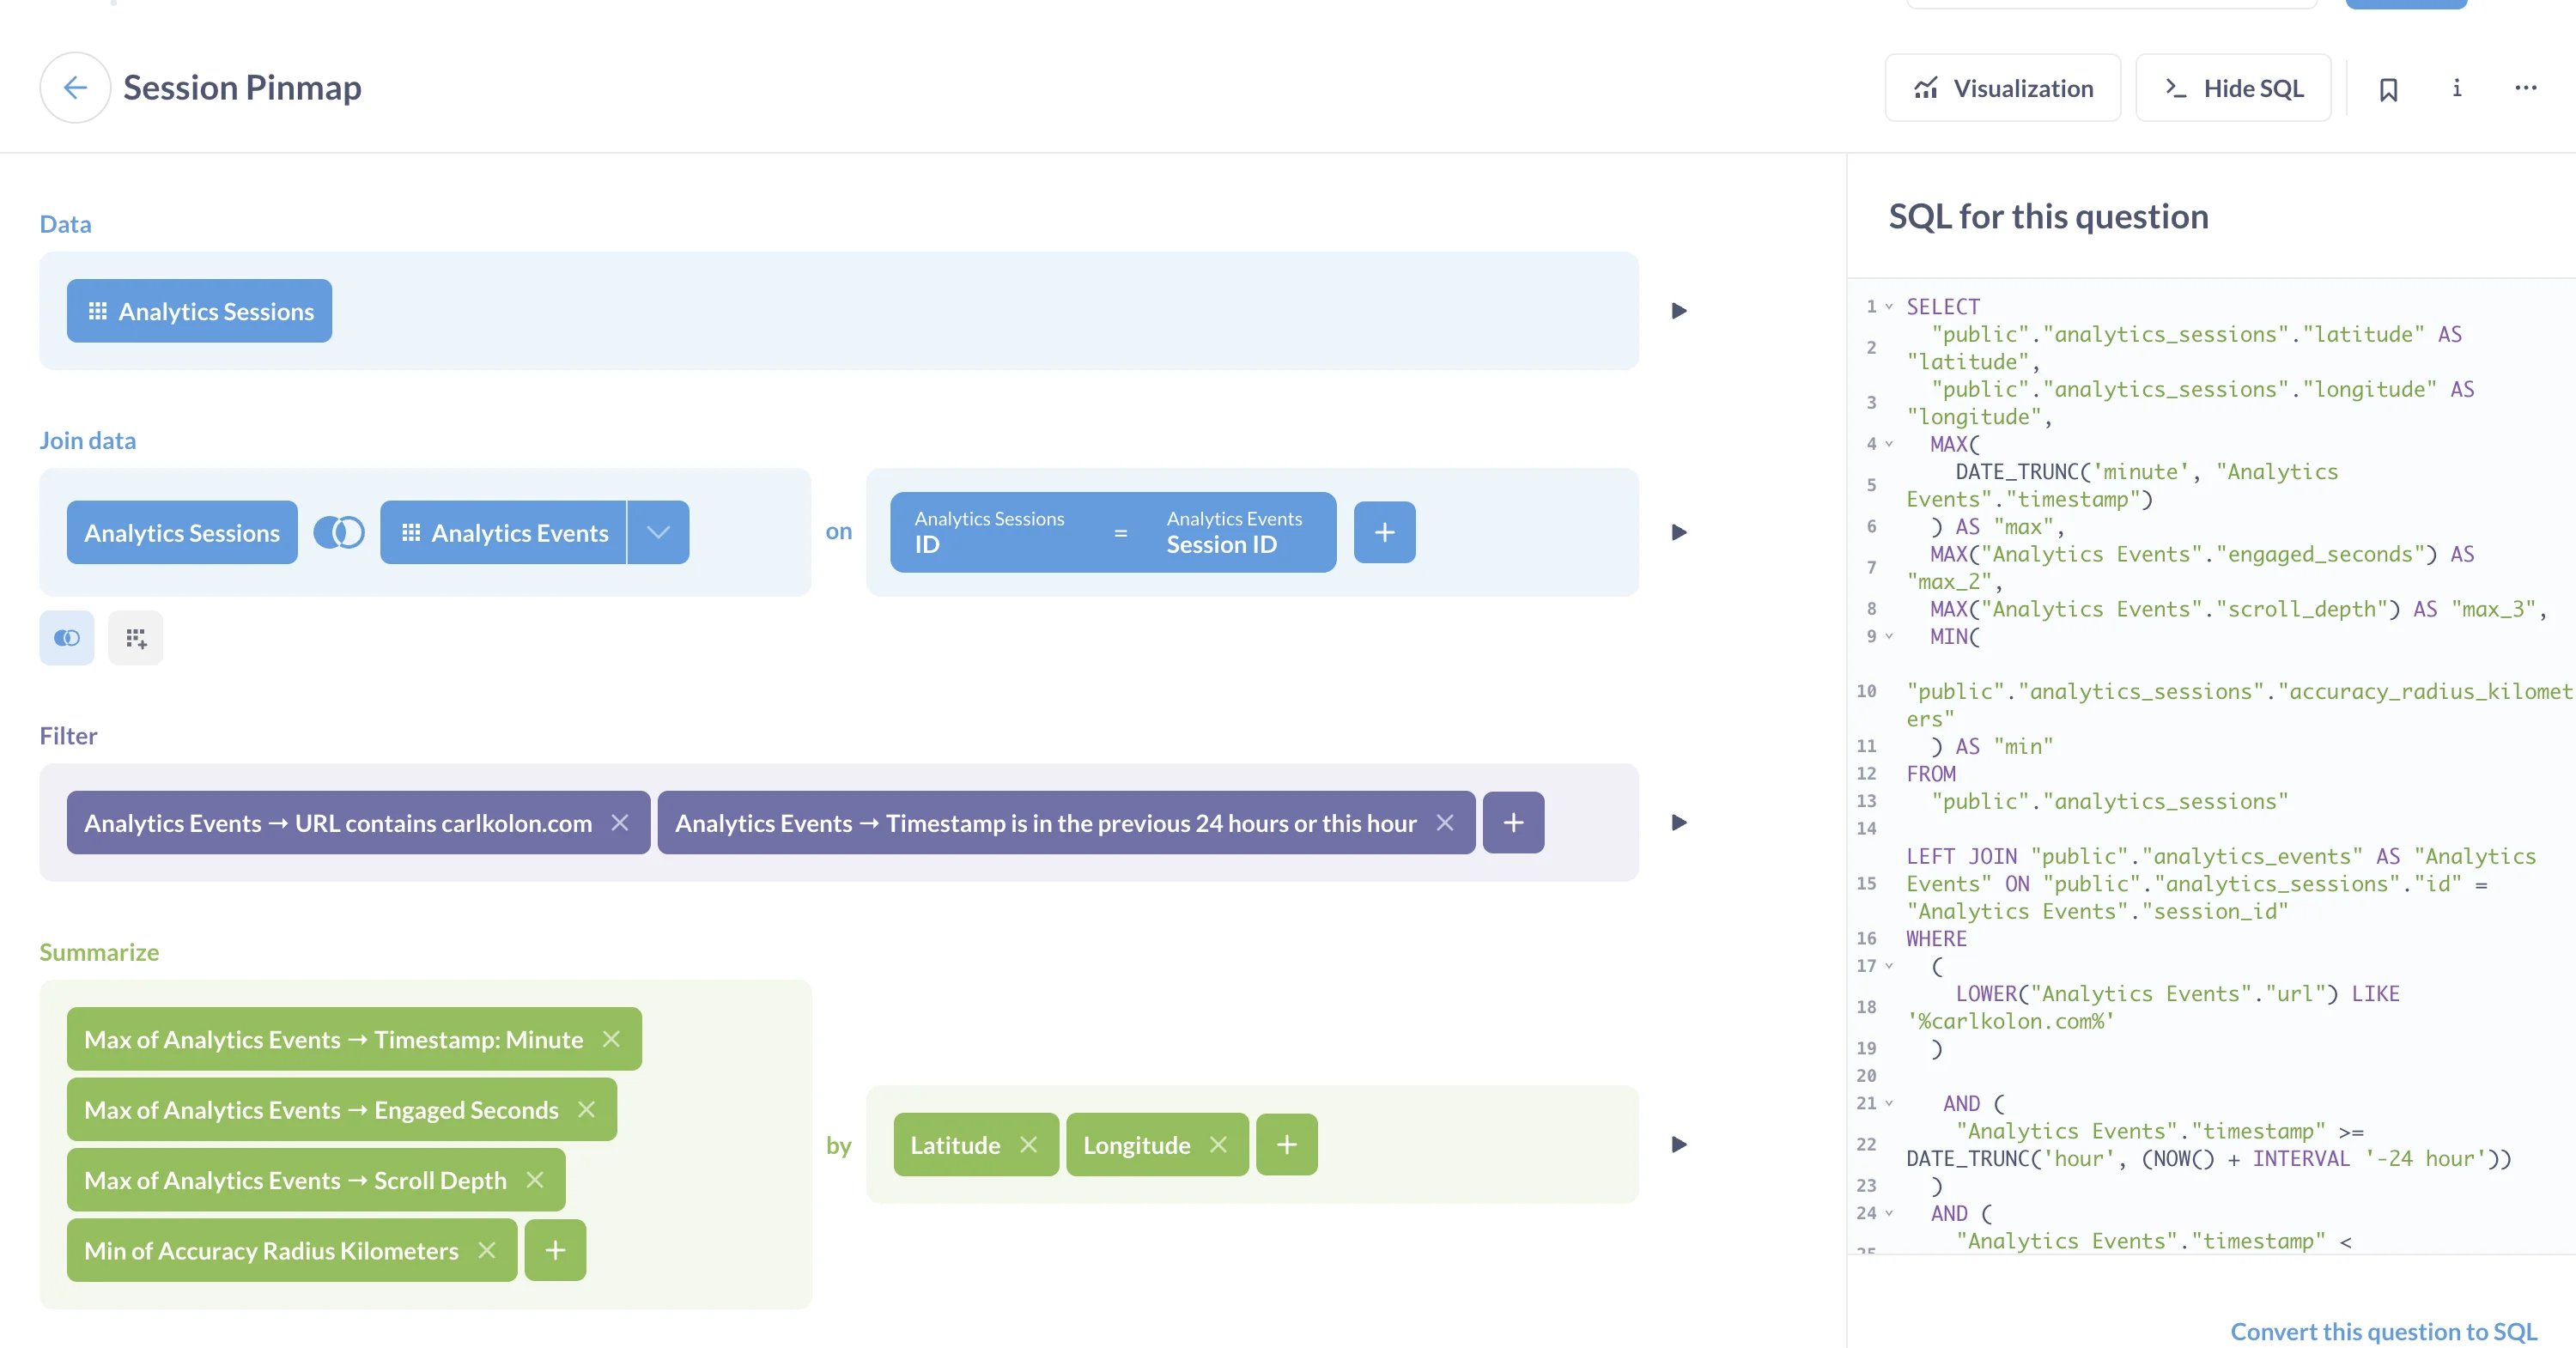
To visualize the data, I set up a Metabase server on my cloud instance. The server loads data from Postgres according to database queries that you can set up in their visual query builder. For example, you can get the following map with the following query:
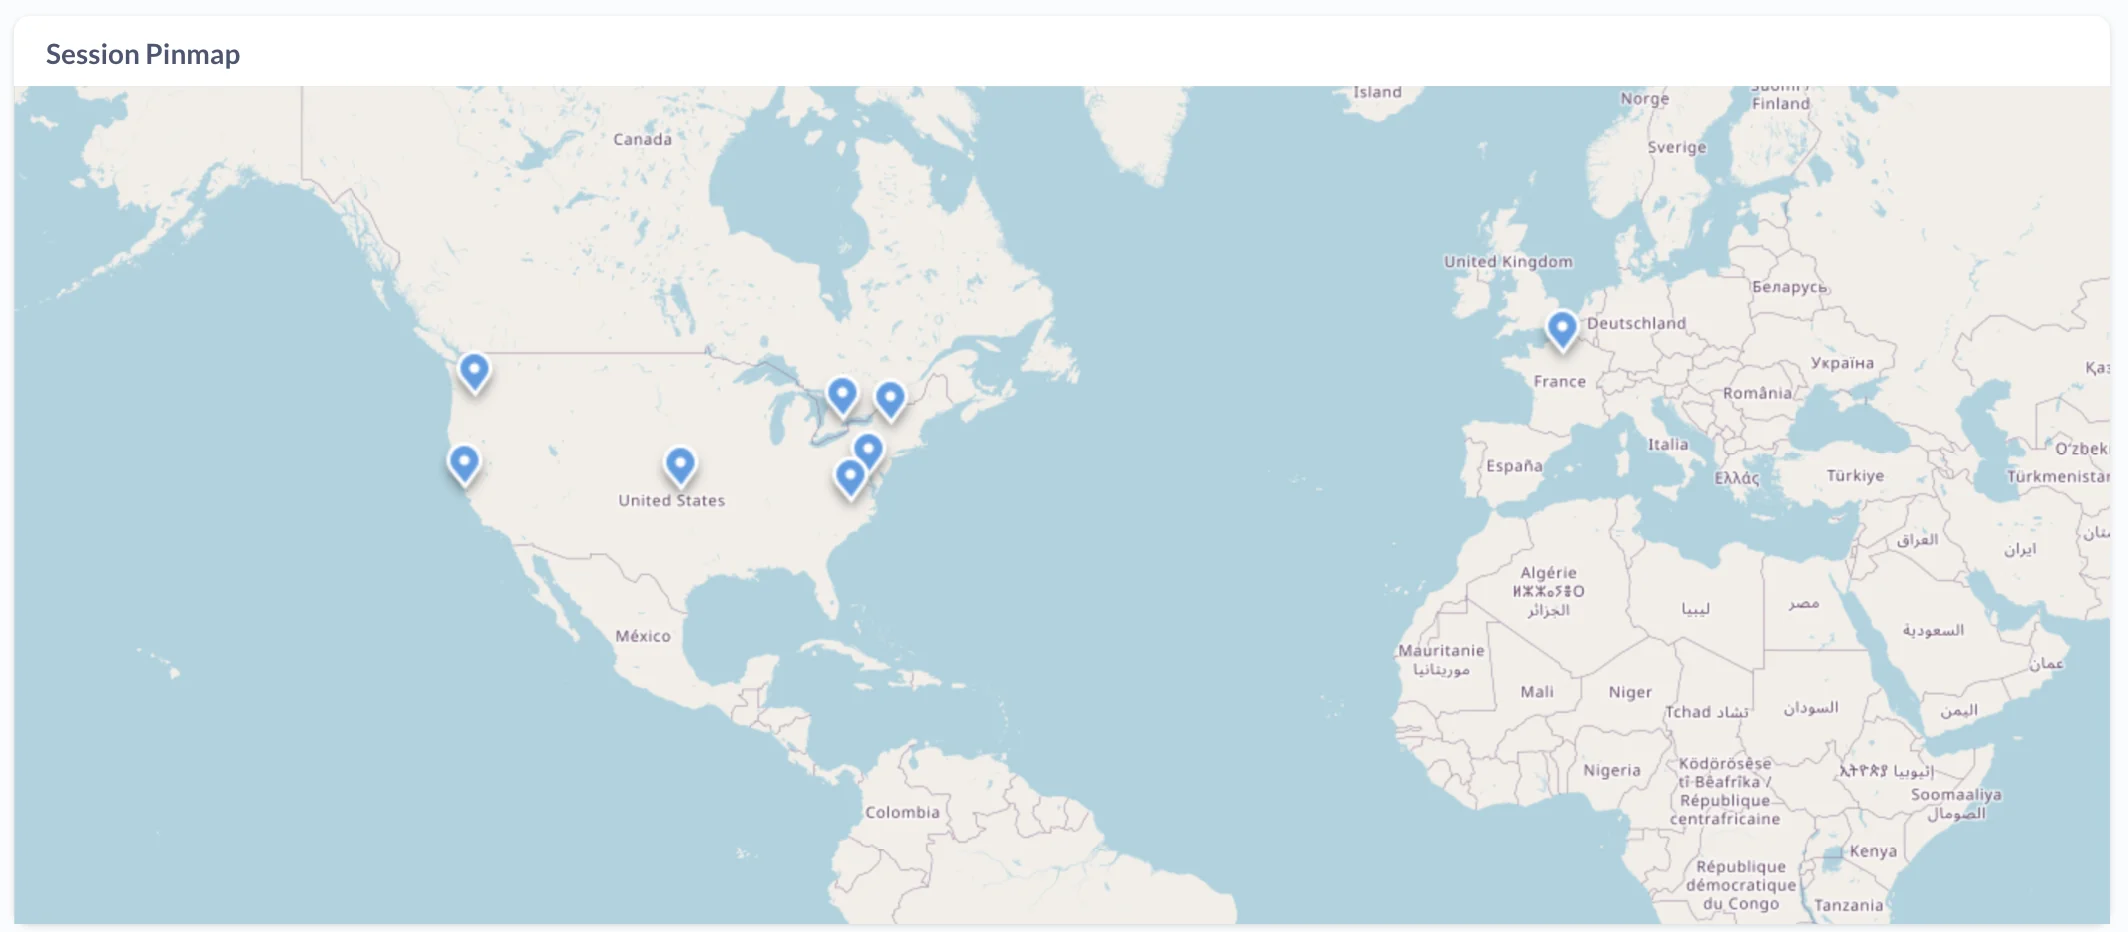
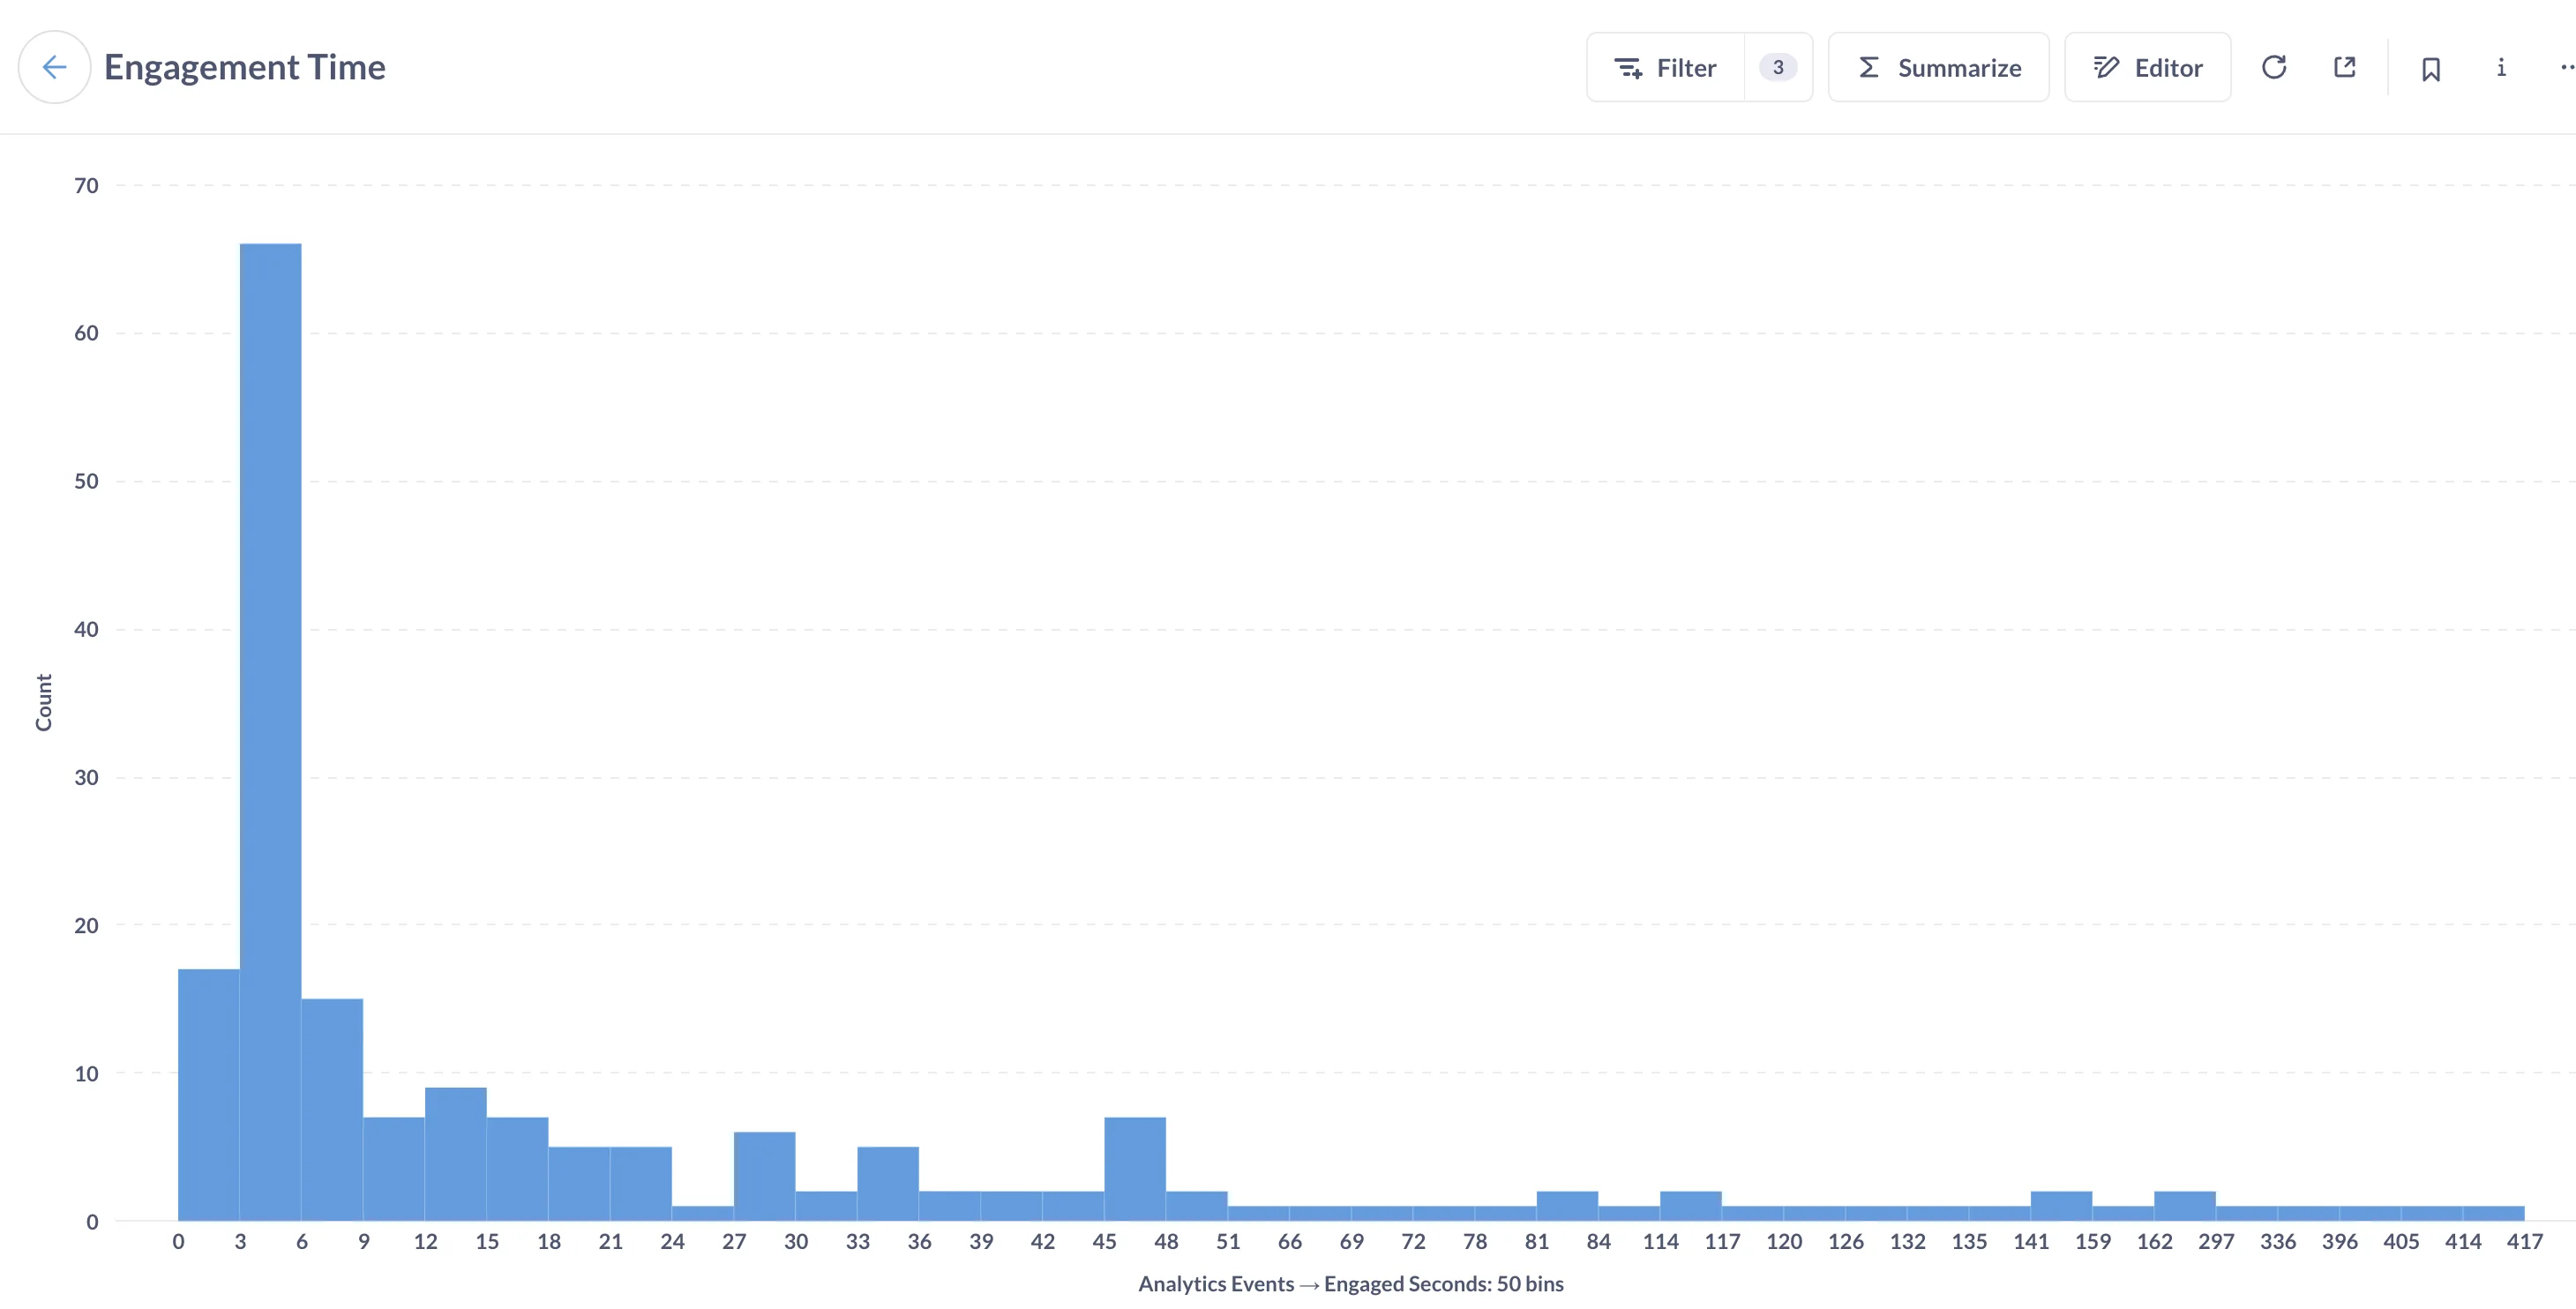
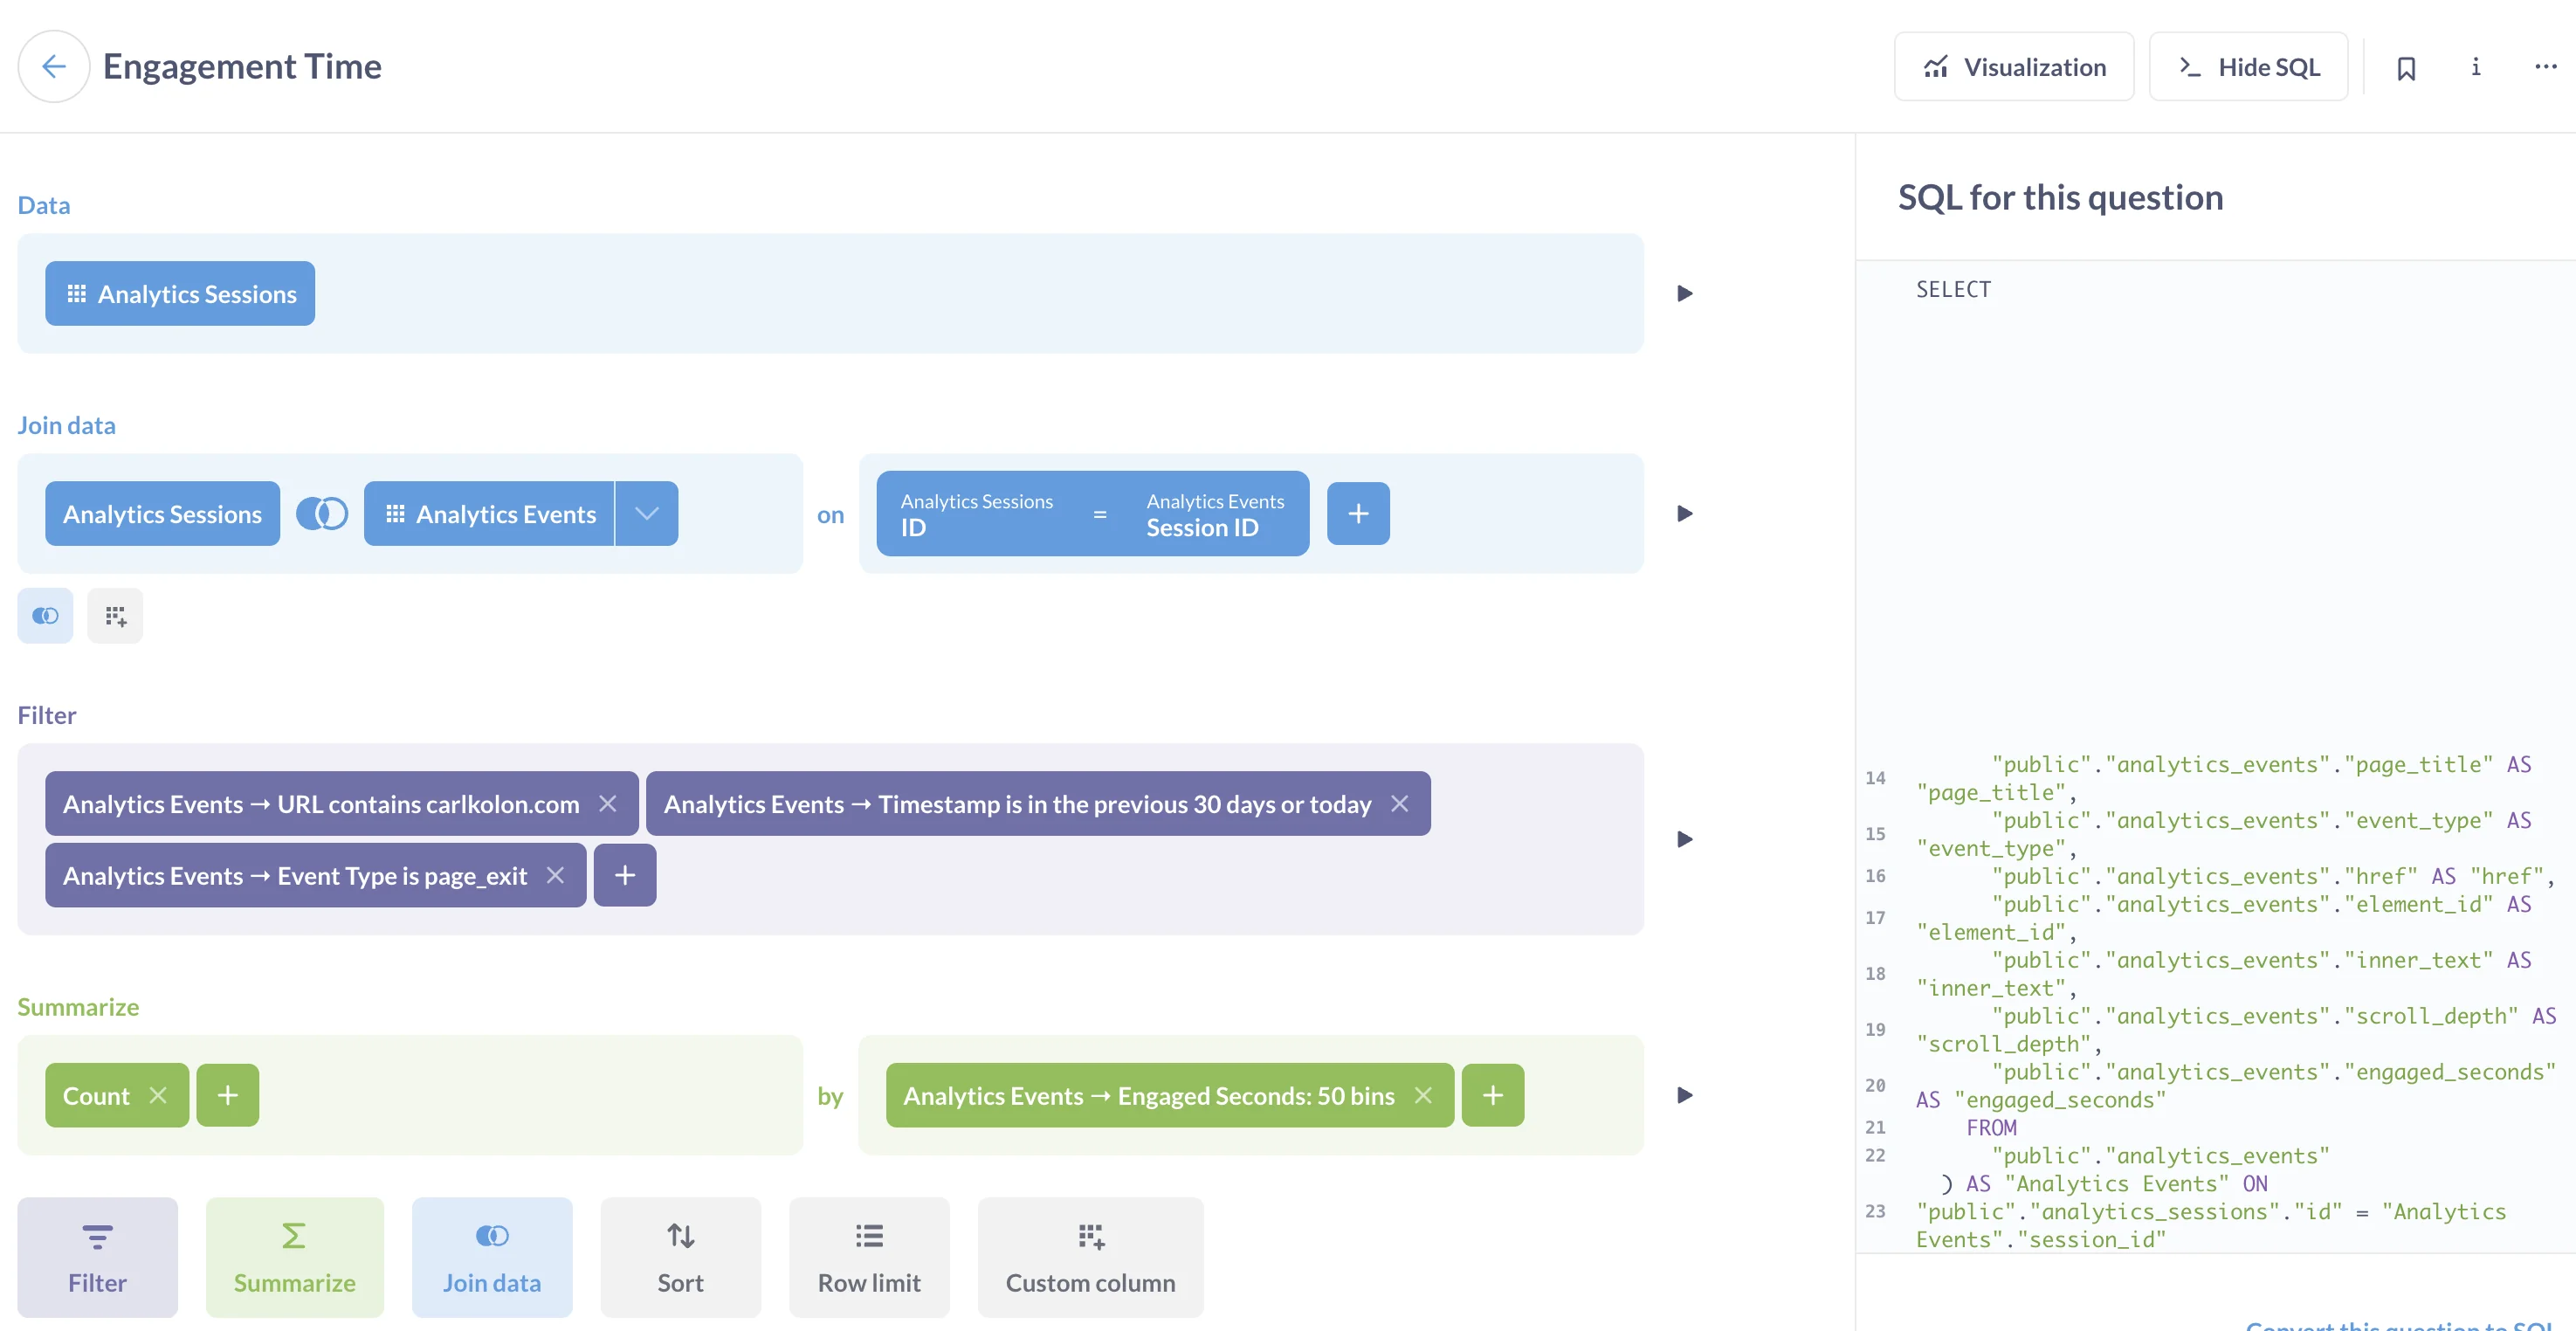
Or you can track user view time like this:
Again, to save money, I am running Metabase in the same container as the FastAPI server and my link shortener Nginx reverse proxy. Luckily this is as simple as installing openJDK and downloading the Metabase application in my dockerfile.
RUN apk update && apk add openjdk21
RUN wget https://downloads.metabase.com/latest/metabase.jar -O metabase.jar
I managed these running processes with supervisord in the container. To store my Metabase config, I added a new table in my cloud Postgres database and pointed the application database there.
Reflections
Is this practical? If I had any real business need to track my users, it wouldn’t be. Still, building this system was a great way to learn the basics about how analytics work, and to make sure I control what happens on my pages.
Will I keep it around? I’m not sure yet. Right now I’m running my analytics system and Google Analytics in parallel to compare, but once I can see that both are consistent, I’ll delete the GA tag.