Norfolk is a pretty bike friendly city. I recently got a Trek FX 3 Disc to ride around, and I’ve become familiar with some of the trails. A few of my favorite spots are the Elizabeth River Trail, Back Bay, and the Great Dismal Swamp canal trail.
While cycling, I sometimes ask myself: what gear should I be in when accelerating, and what gear should I stay in while cycling at a certain speed? I wanted to use some math and simulation to explore this question. I was heavily inspired by Steve Gribble’s wattage to speed graph, but wanted to also look at how gear shifts affect the speed and power of the bike.
Below is a simulation of a person’s speed, acceleration, gear, and cadence as they accelerate from a standstill. There’s also a power graph which shows how this person’s power is used. Read on to learn how I built it, or just play with the values and see what happens.
| Bike Data | |
| Bike Weight (lbs) | |
| Wheel Diameter (mm) | |
| Chain Ring Teeth | |
| Number of Gears | |
| Rear Sprocket Teeth | |
| Human Data | |
| Human Weight (lbs) | |
| Optimal Cadence () (RPM) | |
| Chosen Cadence (RPM) | |
| Max Power () (Watts) | |
| Frontal Area (m^2) | |
| Simulation Data | |
| Simulation Time (sec) | |
| Initial Speed (mph) | |
| Drag Coefficient | |
| Coefficient of Rolling Resistance | |
| Drivetrain Loss (%) | |
| Air Density (kg/m^3) | |
| Grade of Hill (%) | |
| Headwind (mph) |
Explore how the relationship between these numbers changes as you vary headwind, grade, gear ratios.
The above data is based on my bike, so feel free to update it with your own specs. My bike only has a rear derailleur, but if you have a front and rear one you can change the chain ring teeth to 1 and calculate the gear ratios yourself. When you change the number of gears, the rear sprocket teeth box will automatically update. The calculated gear ratios are listed below. More on these later.
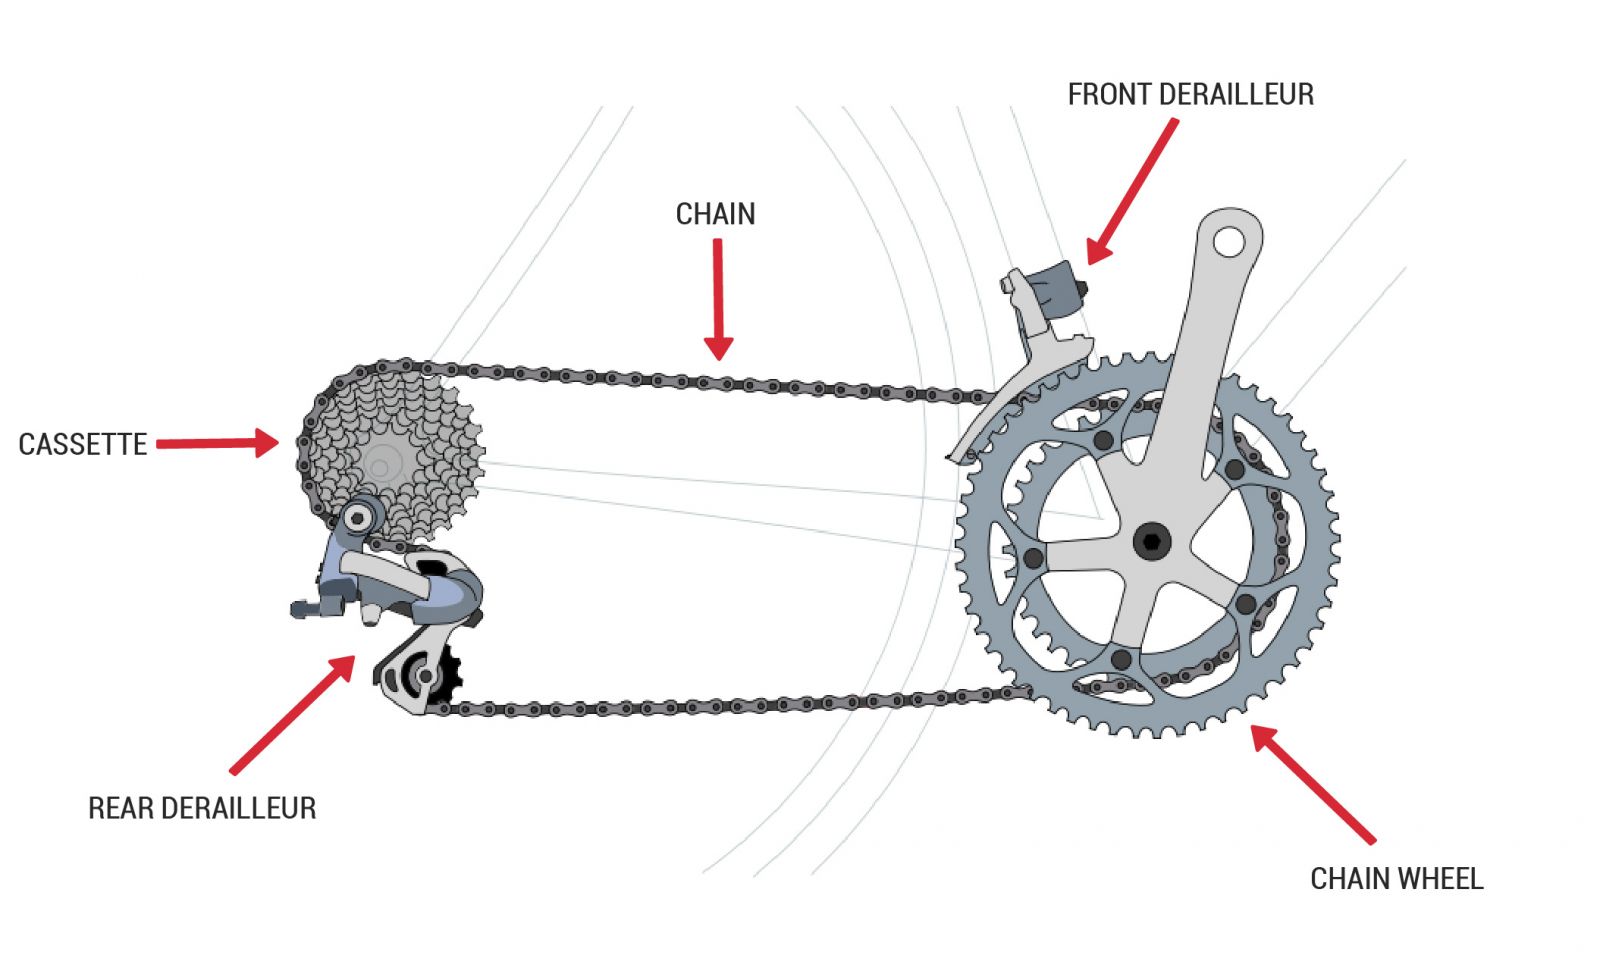
Here’s a quick primer on how bicycle gears work. See the following diagram (courtesy of Sacramento Bike Kitchen) for reference.

Most bikes have a rear derailleur, a mechanism which shifts the drive chain between one of several sprockets on a cassette. The smaller the sprocket is, the faster the rear wheel will turn for a single rotation of the pedals. Sometimes, the chain wheel (or chain ring) itself has multiple sprockets, and shifting between each combination of front and rear sprockets gives a different gear ratio.
In a low gear, a single turn of the pedals produces a small rotation of the rear wheel. This gives the rider a greater mechanical advantage, and allows them to exert more force on the bike. Low gears are used for accelerating from low speeds, climbing hills, and biking into headwinds. A high gear, where a single rotation of the pedals moves the bicycle farther, is used when going downhill or traveling at high speeds.
The optimal cadence () is the cadence at which the rider can produce the most power. Typically, this value is around 120 RPM1, which seems pretty fast. The average biker’s freely chosen cadence will probably be less than this value, so it’s also worth specifying a chosen cadence which the rider will try to maintain. For lots of people, this is around 80-90 RPM2.
The torque that a cyclist can produce is a function of their cadence. Imagine pushing the pedals on a stopped bike. You can probably generate a lot of torque, since the pedals are not moving. Contrast that with a bike that is moving at a high speed. The pedals are moving very fast, and you may not be able to apply any useful amount of force to the pedals. This decrease in torque is approximately linear3.
Where is torque and is rotational frequency (or cadence) measured in RPM. This requires us to know the maximum (or zero-load) torque that a cyclist can produce, and the maximum cadence at which the cyclist can produce torque. We can figure this out from the cyclist’s power, which you can easily measure on a stationary bike. The equation for power on a bicycle is:
Where is angular velocity measured in radians per second. Substituting in the first equation:
This is the equation for a downward-curved parabola. We can find maximum power using calculus:
Solve for :
And since at maximum power will be its optimal value:
To find we can evaluate the power equation at maximum power and rearrange to find torque:
This gives us combined torque and power equations, depending only on , , and pedaling speed.
These are graphed below:
So far, this only tells us how the legs of a cyclist will generate power. What does that tell us about what gear to use? How can we figure out the bike’s acceleration in a certain gear?
It’s tempting to use two equations for power: one for the cyclists legs and the other for the bike’s acceleration:
Where is the forward force on the bike, is the combined mass of the cyclist and bike, is the bike’s acceleration, and is the bike’s velocity. Equating these, we get:
This is what I tried first, but there’s a problem! When the bike is stationary, both and are zero! This means that we cannot find the bike’s acceleration when it is stopped4. Instead, we need to go a little further into the weeds.
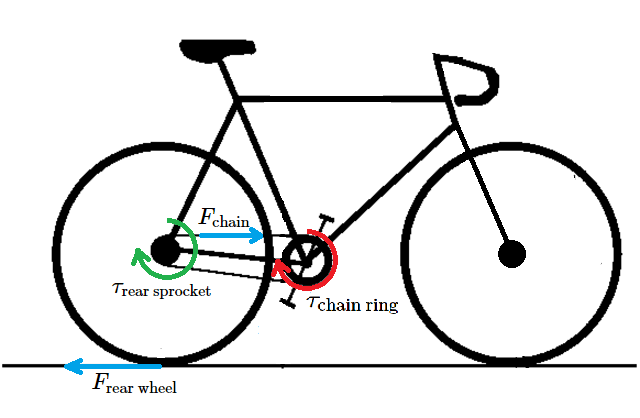
Using the equation for torque, we can determine the force that the chain ring exerts on the chain:
Where is the radius of the chain ring. This force will also be exerted on the rear sprocket, since tension is uniform throughout the chain.
Using the same torque equation, we can find the force exerted on the ground by the rear wheel.
Here’s a picture of the bicycle to help keep these terms straight:

For the chain ring and rear sprocket to grip the chain, the teeth must be evenly spaced. This means that the radius is proportional to the number of teeth. This means that the ratio of the chain ring to rear sprocket radius is the same as the ratio between the number of teeth in the chain ring and the number of teeth in the rear sprocket. This is called the gear ratio.
So the force equation becomes:
To simplify further, we can use the gear inches.
Finally, we have to consider the drive train losses (DTL), which are usually about 2-3%, and fairly consistent across gears5.
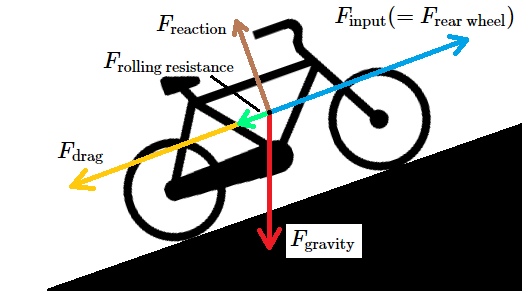
The force exerted by the rider is only one of the forces acting on the bike. We also have to consider the impact of aerodynamic drag, rolling resistance, the force of gravity, and the reaction force from the bike’s contact with the surface. See the following free-body diagram.

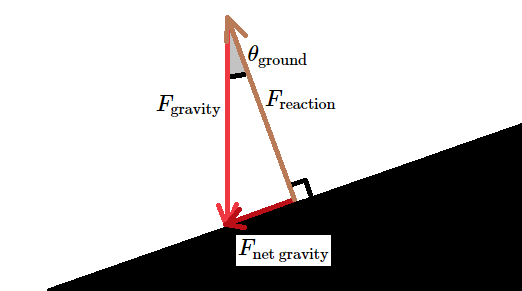
The reaction force will be equal to the force exerted by the bike on the ground, so it will cancel the perpendicular component of the gravitational force exerted by the bike, leaving only the net gravitational force along the surface. This can be calculated using very simple trigonometry.

Where the s are the masses of the bike and rider, and is the acceleration of gravity.
Drag can be calculated using the drag equation. The aerodynamic properties of the rider and bike are fairly well known, and the drag coefficient is typically between 0.6 and 0.8. See the following picture from a review of competition cycling aerodynamics6.

Since the Reynolds number () is high, we can use the drag equation for turbulent flow, which is proportional to the square of the velocity.
Where is the density of air, is the velocity of the bike, is the drag coefficient, and is the frontal area of the rider and bike.
Rolling resistance is the resistive force generated by the tire’s deformation as it rolls over the surface.
Where is the rolling resistance coefficient, which is typically between 0.005 and 0.0157.
This website offers a great comparison of tires by rolling resistance, but unfortunately the comparison is done in watts, based on their testing conditions. To convert these to values, you can divide by 3335.4 W.
Use Newton’s second law and sum all these forces, and we get the acceleration of the bike.
Since the acceleration equations are fairly tame, we can use Euler’s method to numerically solve for the acceleration of the bike.
I implemented this in Javascript, and plotted the results using Chart.js. To find maximum speeds, I simulated with larger time steps and aborted the search when acceleration was smaller than a threshold.
Calculating the amount of power devoted to each of the forces is straightforward, since power is the rate of work done by each force. In a single dimension, we can just use regular multiplication.
Since each force is known, and the velocity is known, the calculation is easy. I plotted these in a stack graph, so that the reader can compare the amounts of power being spent on different forces.
J. Douglas, A. Ross, and J.C. Martin. “Maximal muscular power: lessons from sprint cycling”. ↩
U. Emanuele, T. Horn, and J. Denoth. “The relationship between freely chosen cadence and optimal cadence in cycling”. ↩
Dorel et al. “Force-Velocity Relationship in Cycling Revisited”. ↩
You could make assumptions about the continuity of these equations, and find the limit as and approach zero, but this doesn’t save much time, and it’s better to learn what’s actually going on. ↩
B. Rohloff and P. Greb. Efficiency Measurements of Bicycle Transmissions - a Neverending Story? ↩
T. Crouch et al. Riding against the wind: a review of competition cycling aerodynamics ↩
W. Steyn and J. Warnich. Comparison of tyre rolling resistance for different mountain bike tyre diameters and surface conditions ↩