Since my last post, I’ve gone backpacking a few times, and each time I try to bring a little less. No, I’m not ultralight yet (often defined as base weight under 10 pounds), but I’m pretty close. My last base weight was 12.1.
Once I went through the relatively easy phases of lightening my bag (bring smaller bottles of things, stop bringing changes of clothes, weigh my meals), I started to fantasize about buying another backpack. This time, I thought to myself, I would get one which was incredibly light. My current pack weighs almost two pounds (17% of my base weight!) and I was desperate to take a little weight off.
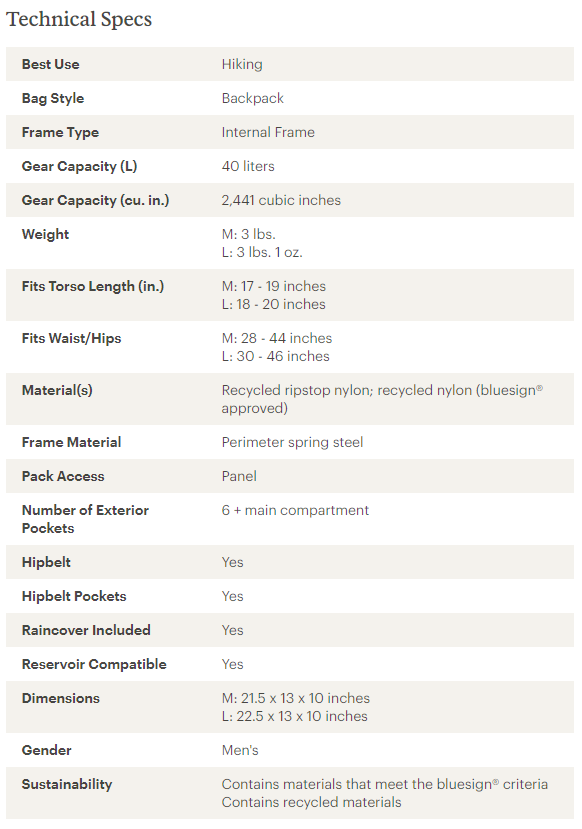
So I went window shopping on the REI site. One of the site’s many cool features is the detailed table of technical specs for each pack. Here’s a picture of a typical backpack info table (this one for the Trail 40 Pack).
So comparing weight on REI is pretty easy. Even better, REI gives an accurate volume measurement of each pack, in cubic inches! Really cool.
Quickly, though, I realized that there are a lot of backpacks. It’s easy to waste all day looking through them. I was terrified of missing a good deal, so I started to chart out a little x-y scatter plot of weight vs. volume. That way, I thought, I could make an informed decision. On writing down my 10th pack, though, I decided there had to be a better way.
So, of course, I wrote a script to do it. First, I looked at this tutorial and loaded the backpack page with python’s requests library. The problem was, the REI page has a lot of dynamic content written in Javascript, and this made the text returned by requests basically useless. In other words, rather than just serving you a static HTML page, the REI website sends you a script, which you run on your own computer, which generates the content that you view in the browser. requests just returns the script, it doesn’t return the final, compiled data.
So I had to get a tool to run the Javascript (acting like a normal browser), and then search through the generated content for the data I was looking for. Thankfully, there’s a tutorial for how to do this as well. The tool I used is called Selenium. Selenium controls a real-life web browser (I used chrome) through a program called a WebDriver. After installing Selenium and ChromeDriver, I imported all the required packages in python, and initialized the browser.
from selenium.webdriver import Chrome
import re
import csv

browser = Chrome('C:\Program Files\ChromeDriver\chromedriver.exe')
I also made a data-carrying class for each backpack:
class Backpack:
	def __init__(self,name,url,volume,weight):
		self.name = name
		self.url = url
		self.volume = volume
		self.weight = weight
The first step of finding the backpack data was compiling a list of backpacks. In order to do this, I initialized an empty set of backpack URLs. I used a set (instead of a list) because of its much more efficient duplicate-detection, and because order didn’t matter to me. Then I made a loop to load each of 15 backpack pages on the REI site. After digging through the page source, I found a few tell-tale signs of a backpack link (search-results ID, li/a xpath). I used Selenium’s element finding functions to get the URL of each link. Then, I checked for duplicates and added it to the set.
backpackurls = set([])

for i in range(15):
	browser.get('https://www.rei.com/c/hiking-backpacks?ir=category%3Ahiking-backpacks&page=' + str(i+1))
	results = browser.find_element_by_id("search-results")
	links =results.find_elements_by_xpath(".//li/a")
	for link in links:
		url = link.get_attribute("href")
		if url not in backpackurls:
			backpackurls.add(url)
Next, I iterated across each URL and found the weight and volume specs in the table. I used regular expressions to convert the volume to a number (of cubic inches) and the weight to a number (of ounces). If I couldn’t find these specs, I dropped the backpack from the list. Lots of backpack-like things were included which I wanted to exclude (like shoulder straps, hydration tubes, etc.), and this did a pretty good job. If I found all the specs successfully, I created a new instance of the Backpack class and added it to the backpacks list.
for url in backpackurls:
	browser.get(url)
	try:
		name = browser.find_element_by_id("product-page-title").text
	except:
		print("Could not find name")
		continue
	print(name)
	volume = None
	weight = None
	try:
		specs = browser.find_elements_by_class_name("tech-specs__row")
	except:
		print("Could not find specs")
		continue
	for row in specs:
		spec = row.find_element_by_class_name("tech-specs__header")
		if spec.get_attribute("textContent").strip() == "Gear Capacity (cu. in.)":
			volume = row.find_element_by_class_name("tech-specs__value").get_attribute("textContent").strip()
			print(volume)
		elif spec.get_attribute("textContent").strip() == "Weight":
			weight = row.find_element_by_class_name("tech-specs__value").get_attribute("textContent").strip()
			print(weight)

	if (volume != None) & (weight != None):
		volumeregex = re.compile("\d+,?\d*(?= ?cu|$)")
		try:
			volumeint = int(volumeregex.search(volume).group().replace(",",""))
		except:
			print("Could not parse volume")
			continue
		poundsregex = re.compile("\d+\.?\d*(?= ?lb| ?pound)")
		ouncesregex = re.compile("\d+\.?\d*(?= ?oz| ?ounce)")
		try:
			pounds = float(poundsregex.search(weight).group())
		except:
			pounds = 0
		try:
			ounces = float(ouncesregex.search(weight).group())
		except:
			ounces = 0
		weightfloat = pounds*16+ounces
		if weightfloat == 0:
			continue
		backpacks.append(Backpack(name,url,volumeint,weightfloat))
	else:
		print("Could not find specs")
This part really made me feel cool. Look at the automation!
To put a little damper on my enthusiasm, I realized after a day or so that REI had blocked me…

Finally, once I finished searching each URL, I saved the results to a CSV file.
with open("backpacks.csv","wt",newline='') as fp:
	writer = csv.writer(fp, delimiter=",")
	backpacklist = []
	for i in backpacks:
		backpacklist.append([i.url,i.name,i.volume,i.weight])
	writer.writerows(backpacklist)
Once I dug through the CSV a bit, I found that not everything was a backpack. In fact, there were 5 main types of products.
I played with a couple options to automatically classify these, but in the end I just took the 10 minutes and did it myself.
Once I had the data in a CSV, I labeled it and imported it into python using pandas, a data analysis library similar to R.
import pandas as pd
backpacks = pd.read_csv("backpacks.csv")
I could use pandas to make a simple scatter plot pretty similar to the one I could make in Excel, but this wasn’t a great solution. I wanted to make my scatter plot interactive: to hover over a dot and see which pack it represented, so that I could find it easily. After all, isn’t the whole point of this exercise to find the backpack I want?
So rather than using pandas to display the data, I used plotly, which did exactly what I wanted. Here’s a great tutorial about how to make interactive scatter plots.
import plotly.io as pio
pio.renderers.default='browser'
import plotly.express as px
fig = px.scatter(backpacks,x="Capacity (cu. in.)",y="Weight (oz.)",color="Type",hover_name="Name")
fig.write_html("backpackplot.html")
The HTML file which plotly generated is huge and disgusting. Instead of copying and pasting it directly, I embedded it in this webpage. Here’s what it looks like.
From this chart, we can see that stuff sacks and child carriers are in a fairly different class from the rest of the packs. For the remainder of this article, I will constrain the data to small bags, backpacks, and hydration packs, which all fall more or less on the same line, and should obey fairly consistent scaling rules.
The chart above gives us a pretty good image of what a more “efficient” backpack is. The lower (lighter) and farther to the right (bigger) a backpack is, the better. It would be cool, though, if we could come up with a numerical rating of the “efficiency” of a backpack. The most intuitive way is to divide the volume of the backpack by its weight. Borrowing from physics, I call this its specific volume. A higher specific volume means a more efficient pack. Here’s a chart.
Rating each backpack by its specific volume makes a lot of sense, and you can see how easy it becomes to pick out the truly great backpacks. Up at the top, we have packs with very high volume to weight ratio. Here are four outstanding ones.
There’s still a problem with this method, though. The scatter plot still has an upward slope. In other words, bigger packs tend to have better specific volume. This means that the metric of specific volume is biased towards larger packs.
Why is this? It’s easier to see if we imagine the backpack as a simpler shape, like a fabric-covered cube. If we double the side length of the cube, the volume will increase by a factor of 8 (\(2^3\)). But how much should we expect the weight to increase?
If the weight of the cube is proportional to the amount of fabric on its surface, it is proportional to the surface area, which means that it will only increase by a factor of 4 (\(2^2\)). The specific volume of the cube will then increase by 8/4: a factor of two! In this case, the weight of the cube is proportional to the 2/3 power of the capacity.
\[\text{weight}\propto\left(\text{capacity}\right)^{2/3}\]On the other hand, we will need thicker fabric (or more gizmos) for larger bags. In this case, we might expect the thickness of the fabric to double as well. This will cause the weight to increase by a factor of 8 (\(2^2\times 2\)), so the specific volume of the cube will remain constant, and the weight of the cube is proportional to the capacity.
\[\text{weight}\propto\text{capacity}\]In reality, I expect the behavior of a backpack’s specific volume to lie somewhere in between these extremes.
\[\text{weight}\propto\left(\text{capacity}\right)^{n}\] \[\frac23 \leq n \leq 1\]I was inspired to think about backpack dimensionality by the concept of Hausdorff dimension. Hausdorff dimension is usually studied in the context of fractals. One of the key insights in fractal geometry is that an object’s measure (informally, mass) does not always scale with an integer power of its side length. For us, this means that \(n\) can be any value!
We can use a simple proportionality equation to transform the weight-capacity relationship into:
\[w=ac^n\]Where \(w\) is the weight, \(c\) is the capacity, and \(a\) and \(n\) are constants. The goal is to determine the best values of \(a\) and \(n\), given our data.
I’ve solved problems like this before with linear regression, but the data is not yet linear. To make it linear, we can use some handy properties of logarithms.
\[\begin{align*} \log(w) &= \log(ac^n)\\ &= \log(a) + n\log(c) \end{align*}\]Note: It doesn’t really matter, but here, \(\log\) represents the natural logarithm. This is a notation hill that I will die on.
Now the equation is linear, so all we have to do is run a linear regression on \(\log(w)\) vs \(\log (c)\). This will give us \(n\) (the slope) and \(\log(a)\) (the y-intercept). This is easy to do with pandas and sklearn.
from sklearn.linear_model import LinearRegression
backpacks["log(c)"]=np.log(backpacks["Capacity (cu. in.)"])
backpacks["log(w)"]=np.log(backpacks["Weight (oz.)"])
logc = np.array(backpacks["log(c)"]).reshape(-1, 1)
logw = np.array(backpacks["log(w)"]).reshape(-1, 1)
linear_regressor = LinearRegression()
linear_regressor.fit(logc, logw)
backpacks["Best Fit"] = linear_regressor.predict(np.vstack(backpacks["log(c)"]))
fig = px.scatter(backpacks,x="log(c)",y="log(w)",color="Type",hover_name="Name")
fig.add_trace(go.Scatter(name='Regression Results', x=backpacks["log(c)"], y=backpacks['Best Fit'], mode='lines'))
fig.write_html("loglog.html")
This regression gives us the following values of \(n\) and \(a\):
> linear_regressor.coef_[0,0]
0.8137364331289876 # this is n

> np.exp(linear_regressor.intercept_)[0]
0.07817853902023034 # this is a
This makes sense! \(n\) is pretty much right between our two predictions, and \(a\) is small. We can substitute these values back into the \(w=ac^n\) equation, and plot the results - our expected volume/weight curve - on the first graph.
backpacks["Scale Prediction"] = np.exp(linear_regressor.predict(np.vstack(backpacks["log(c)"])))
fig = px.scatter(backpacks,x="Capacity (cu. in.)",y="Weight (oz.)",color="Type",hover_name="Name")
fig.add_trace(go.Scatter(name='Regression Results', x=backpacks["Capacity (cu. in.)"], y=backpacks['Scale Prediction'], mode='lines'))
fig.write_html("hausdorff.html")
…okay, so that line is barely curved, which basically tells us that we might as well have been using specific volume this entire time. Still, it was a fun exercise. To take it one step further, we can design a new metric, similar to specific volume, which is resistant to the biases of specific volume. I call it the Backpack Rating Factor (BRF).
\[\text{BRF} = \frac{ac^n}w\]This graph shows us that the Flash 18 is the ultimate champion. After staring at backpacks for so long, though, I decided to stick with my Kelty for now.